Validation: src/calliope/oxygen_fugacity.py
What this page checks
This page checks the iron-wüstite (IW) buffer in CALLIOPE.
The oxygen fugacity \(f\mathrm{O_2}\) [bar] measures how oxidising the melt is, in the form of an effective O\(_2\) pressure.
The IW buffer is the \(f\mathrm{O_2}\) at which iron metal and wüstite (FeO) are in equilibrium, and CALLIOPE gives the \(f\mathrm{O_2}\) of a run as a shift \(\Delta\mathrm{IW}\) from it in log10 units.
OxygenFugacity gives \(\log_{10} f\mathrm{O_2}\) of the buffer from one of 3 published fits: Hirschmann (2021)2, the default, Fischer et al. (2011)1 and O'Neill and Eggins (2002)3.
Validation means that a test runs the code on a case where another source gives the right answer, and checks the result within a stated tolerance.
If the buffer is wrong, every reaction with O\(_2\) and every solubility law that depends on \(f\mathrm{O_2}\) gets a wrong value.
Each case below says why the check exists, what it tests, how we know the right answer and why it matters, and a box "Test details" ends it.
Terms used on this page.
- dex: a difference in log10 units; 0.05 dex is a factor of \(10^{0.05} \approx 1.12\).
- Regression check: a test that compares the code with a stored value, a result the code gave before. It fails when the result changes, but it does not show that the result is right.
- Cross-check: a comparison with a second published fit or a second code.
- atmodeller: an outgassing code that PROTEUS can use in place of CALLIOPE.
Fischer buffer at 2000 K
Why this check exists. A typo in the coded Fischer expression, a dropped log10, a slip in the temperature unit, or a call that takes the O'Neill and Eggins fit in place of the Fischer fit gives a wrong buffer without an error message.
What it tests. At \(T\) = 2000 K and 1 bar the code gives \(\log_{10} f\mathrm{O_2}\) = -7.14981 for the Fischer fit. The test requires the coded form \(6.94059 - 28180.8/T\) to a relative 1e-4. It also requires that the Fischer value lies 0.258 dex above the O'Neill and Eggins value (-7.4078) to 0.02 dex, that it is more than 0.2 dex from that value, and that it lies between -10 and -3.
How we know the right answer. This case is a regression check and a cross-check between 2 published fits, not a pin to independent data. Fischer et al. (2011) compute the 1 bar Fe-FeO curve from the JANAF tables of Chase (1998)4 (their Fig. 6) and add the pressure integral of their Eq. 2; their supplement (Table S2) gives a P-T polynomial. The paper does not state the source of the 2-term form in the code. Neither the supplement of Fischer et al. nor the JANAF Fe, FeO and O\(_2\) tables are in the test data, so the test pins the coded form and its 0.258 dex offset from O'Neill and Eggins (2002).
Why it matters. CALLIOPE uses the Fischer fit when the input dictionary sets fO2_model = 'fischer', and the comparison of CALLIOPE with atmodeller uses it (cross-code comparison).
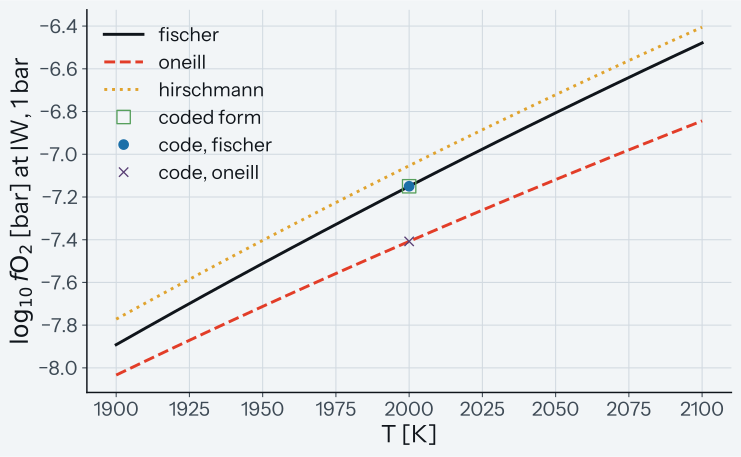
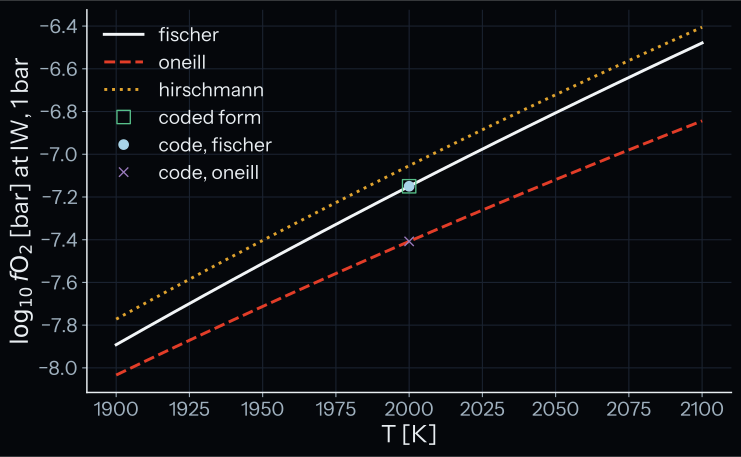
How to read the plot. The lines are the 3 buffers from OxygenFugacity at 1 bar and give context; the y-axis is \(\log_{10} f\mathrm{O_2}\) in bar. The test asserts the 3 marks at 2000 K: the Fischer code value (circle), the coded form (square) and the O'Neill and Eggins value (cross). A pass means that the circle agrees with the square to a relative 1e-4, too small to see. The circle must also lie 0.258 dex above the cross, to within 0.02 dex.
Known limit. This case is a regression check of the coded form and of its offset from O'Neill and Eggins; it does not compare the Fischer fit with independent data.
Test details
- Reference: Fischer et al. (2011)1, EPSL 304, 496 (doi:10.1016/j.epsl.2011.02.025); cross-checked against O'Neill and Eggins (2002)3.
- Tolerance: relative 1e-4 on the coded form; offset 0.258 dex to 0.02 dex; more than 0.2 dex from O'Neill and Eggins; \(-10 < \log_{10} f\mathrm{O_2} < -3\).
- Test id:
tests/test_oxygen_fugacity.py::test_oxygen_fugacity_fischer_value_at_2000K_cross_check_and_regression - Command:
pytest tests/test_oxygen_fugacity.py -k fischer_value_at_2000K
Worked numbers
OxygenFugacity('fischer') evaluates:
log10(fO2)_IW(T) = 6.94059 - 28.1808e3 / T
At T = 2000 K:
log10(fO2) = 6.94059 - 14.0904 = -7.14981
O'Neill and Eggins (2002) at the same T:
log10(fO2) = 2 * (-244118 + 115.559*T - 8.474*T*ln(T)) / (ln(10) * 8.31441 * T)
           ≈ -7.4078 at T = 2000 K
A call that silently takes the wrong buffer lands 0.26 dex away from the expected value.
Hirschmann buffer at 1473 K
Why this check exists. The Hirschmann fit is the default buffer of CALLIOPE. A change of its Table 1 coefficients that moves the value at 1473 K by more than 0.05 dex, a call at the wrong pressure, or a call that takes another fit gives the wrong default buffer, and this case catches each of them.
What it tests. At \(T\) = 1473 K and 1 bar the code gives \(\log_{10} f\mathrm{O_2}\) = -11.957. The test requires -11.94, with a tolerance of 0.05 dex. It also requires that the value differs by more than 0.2 dex from the Fischer value (-12.191) and from the O'Neill and Eggins value (-11.699). A call at 1 kbar must differ by more than 0.03 dex, so the test catches a call at the wrong pressure. The value must lie between -14 and -10.
How we know the right answer. Fig. 5 of Hirschmann (2021) shows the IW value at 1473 K and 1 bar at about -11.94. The value is read off the figure, so the tolerance is 0.05 dex.
Why it matters. Every solve that does not set fO2_model uses this buffer, so every \(\Delta\mathrm{IW}\) of such a solve is relative to it.
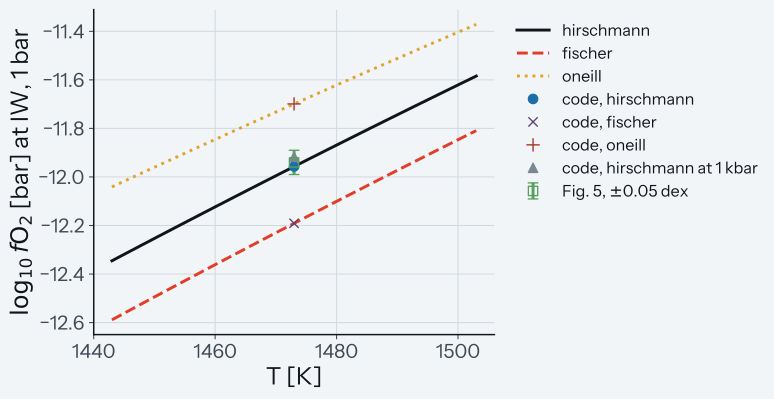
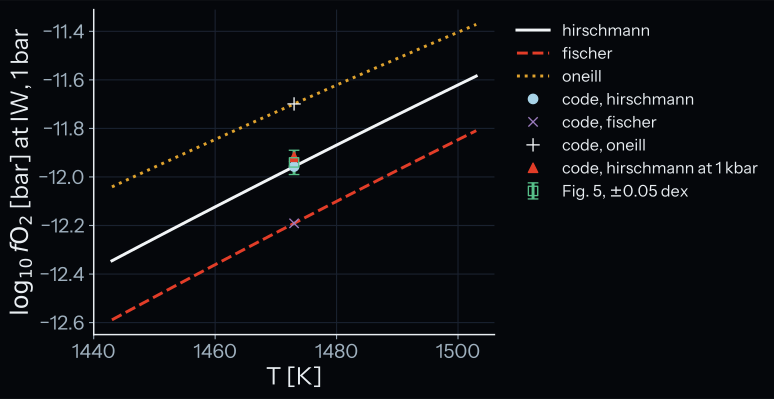
How to read the plot. The lines are the 3 buffers from OxygenFugacity at 1 bar and give context; the y-axis is \(\log_{10} f\mathrm{O_2}\) in bar. The test asserts the marks at 1473 K. The circle is the Hirschmann code value, and the square with its error bar of 0.05 dex is the figure value. The lower cross (x) is the Fischer value and the upper cross (+) is the O'Neill and Eggins value. The triangle is the Hirschmann value at 1 kbar. A pass means that the circle lies inside the error bar and both crosses lie more than 0.2 dex from the circle. The circle must also equal the 1 bar value of the Hirschmann buffer to 1e-12. The triangle lies 0.04 dex above the circle and overlaps it at this scale; the test requires more than 0.03 dex. The square of the figure value sits behind the circle and the triangle.
Known limit. The reference value is read off a figure, so the case catches only changes larger than 0.05 dex.
Test details
- Reference: Hirschmann (2021)2, GCA 313, 74, Table 1 and Fig. 5 (doi:10.1016/j.gca.2021.08.039).
- Tolerance: 0.05 dex (value read from a figure); more than 0.2 dex from Fischer and from O'Neill and Eggins; more than 0.03 dex from the 1 kbar value.
- Test id:
tests/test_oxygen_fugacity.py::test_oxygen_fugacity_hirschmann_value_at_1473K_matches_published_figure - Command:
pytest tests/test_oxygen_fugacity.py -k hirschmann_value_at_1473K - Companion test:
test_oxygen_fugacity_hirschmann_branches_continuous_at_fcc_hcp_boundarychecks the Table 1 coefficients another way. The fit has one branch for fcc/bcc iron and one for hcp iron, which meet at the boundary of Eq. 18. At 1000, 1500, 2000, 2500 and 3000 K the jump between them must be below 0.056 dex, twice the published maximum fit mismatch of 0.028 dex; the fit gives at most 0.0185 dex.
Hirschmann buffer under pressure
Why this check exists. The Hirschmann fit has a pressure term. A slip between bar and GPa changes the pressure slope by a factor of \(10^4\), and a wrong sign moves the buffer the wrong way under pressure.
What it tests. The test takes the change of \(\log_{10} f\mathrm{O_2}\) from 1 bar to 1 GPa at 1200, 2000 and 3000 K. At each temperature this slope must differ by less than 15 % from the estimate \(2\,\Delta V / (R\,T \ln 10)\), and it must be positive. Here \(\Delta V\) [m\(^3\) mol\(^{-1}\)] is the volume change of the solids in the reaction Fe + 1/2 O\(_2\) = FeO, \(R\) = 8.314 J mol\(^{-1}\) K\(^{-1}\) is the gas constant, and the slope is in dex per Pa; the test gives it in dex per GPa. The fit is 7.5 %, 8.2 % and 10.4 % above the estimate at the 3 temperatures.
How we know the right answer. In the reaction Fe + 1/2 O\(_2\) = FeO, only the solids Fe and FeO change their volume with pressure in the free energy of the reaction, while O\(_2\) enters through \(f\mathrm{O_2}\). So \(\log_{10} f\mathrm{O_2}\) changes with pressure as \(2\,\Delta V / (R\,T \ln 10)\), where \(\Delta V\) is the volume change of the solid phases and the factor 2 comes from the 1/2 O\(_2\) (an analytical limit). \(\Delta V = V(\mathrm{FeO}) - V(\mathrm{Fe})\), with \(V(\mathrm{FeO})\) = 12.256 cm\(^3\) mol\(^{-1}\) from Hirschmann (2021) Appendix A and \(V(\mathrm{Fe}) = 55.845/7.874\) cm\(^3\) mol\(^{-1}\) from the density of alpha iron. These volumes are at room temperature and leave out thermal expansion and the change of stoichiometry, so the test allows 15 %.
Why it matters. The solve evaluates every buffer at 1 bar, so that \(\Delta\mathrm{IW}\) has one meaning. The pressure term gives the buffer at depth when a caller passes P_bar to OxygenFugacity.hirschmann, and this case checks that term.
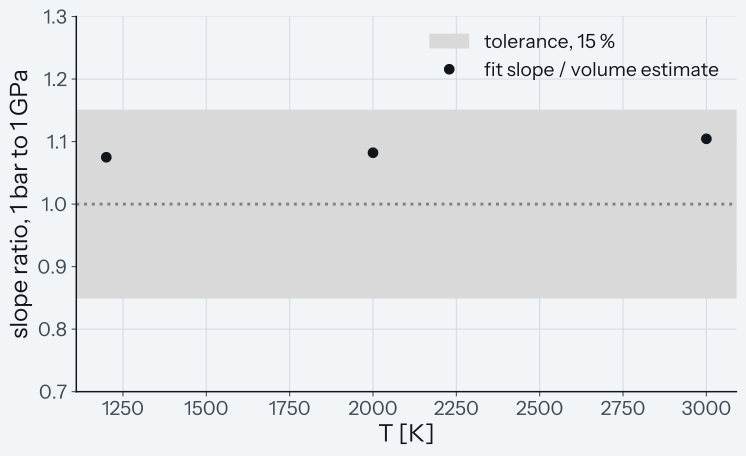
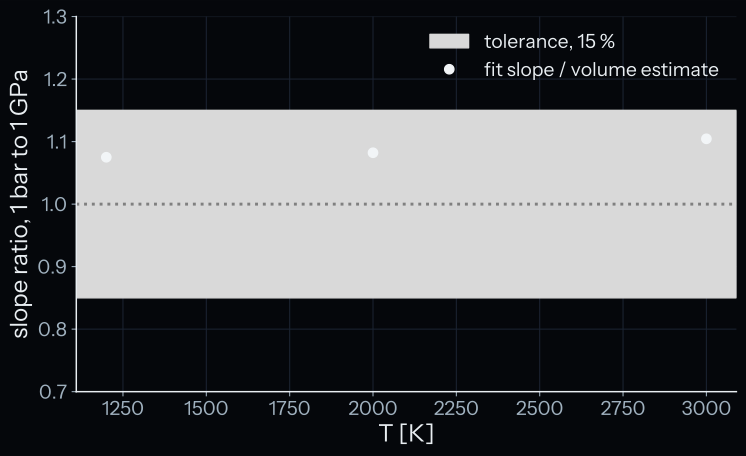
How to read the plot. Each mark is the change of \(\log_{10} f\mathrm{O_2}\) from 1 bar to 1 GPa divided by the estimate from \(\Delta V\), at one of the 3 temperatures. The grey band is the tolerance of 15 % and the dotted line is a ratio of 1. A pass means that all 3 marks lie inside the band. They sit 7.5 % to 10.4 % above 1.
Test details
- Reference: analytical limit \(d \log_{10} f\mathrm{O_2} / dP = 2\,\Delta V / (R\,T \ln 10)\); Hirschmann (2021) Appendix A for \(V(\mathrm{FeO})\).
- Tolerance: relative 0.15 at 1200, 2000 and 3000 K; slope positive.
- Test id:
tests/test_oxygen_fugacity.py::test_oxygen_fugacity_hirschmann_low_pressure_slope_matches_volume_change - Command:
pytest tests/test_oxygen_fugacity.py -k low_pressure_slope
Default buffer
The default IW buffer of CALLIOPE is Hirschmann (2021), DEFAULT_FO2_MODEL in src/calliope/oxygen_fugacity.py. A test that pins an IW value must check it against the other buffers, so that a change of the default, or a config that silently selects another buffer, does not move the reference of the test. The Fischer case checks against O'Neill and Eggins, and the Hirschmann case at 1473 K against both other buffers.
Related code and pages
src/calliope/oxygen_fugacity.py(OxygenFugacity.hirschmann,OxygenFugacity.fischer,OxygenFugacity.oneill): the 3 buffers. An inline comment inOxygenFugacity.oneillkeeps the coded gas constant8.31441J mol\(^{-1}\) K\(^{-1}\); a change, for example toconstants.R_gas, moves every IW value of this buffer.- Oxygen fugacity: the explanation page, with the observed values (Earth about IW+3.5, Mars about IW, Mercury IW-2.8 to IW-5.4) for the buffers.
- Cross-code comparison: CALLIOPE with the Fischer buffer (passed as
fO2_model='fischer'by the comparison script) against atmodeller with the Hirschmann buffer, with a residual of 0.16 dex at the Earth case.
References
-
R. A. Fischer, A. J. Campbell, G. A. Shofner, O. T. Lord, P. Dera, V. B. Prakapenka, Equation of state and phase diagram of FeO, Earth and Planetary Science Letters, 304, 496-502, 2011. SciX. ↩↩
-
M. M. Hirschmann, Iron-wüstite revisited: A revised calibration accounting for variable stoichiometry and the effects of pressure, Geochimica et Cosmochimica Acta, 313, 74-84, 2021. ↩↩
-
H. St. C. O'Neill, S. M. Eggins, The effect of melt composition on trace element partitioning: an experimental investigation of the activity coefficients of FeO, NiO, CoO, MoO\(_2\) and MoO\(_3\) in silicate melts, Chemical Geology, 186, 151-181, 2002. SciX. The IW expression of the code uses the free energy of Fe + 0.5 O\(_2\) = FeO(liquid) in their Table 6, p. 163. ↩↩
-
M. W. Chase, NIST-JANAF Thermochemical Tables, 4th edition, Journal of Physical and Chemical Reference Data Monograph 9, 1998. ↩