Validation: src/calliope/chemistry.py
What this page checks
This page checks the equilibrium constants that CALLIOPE uses to split the gas between reduced and oxidised species.
An equilibrium constant \(K\) fixes the ratio of the partial pressures of the products and reactants of a reaction at a given temperature.
CALLIOPE folds the oxygen fugacity \(f\mathrm{O_2}\) (defined below) into it: ModifiedKeq returns \(G_\mathrm{eq} = 10^{\log_{10} K - \nu \log_{10} f\mathrm{O_2}}\), where \(\nu\) is the exponent of the oxygen fugacity that the reaction method returns, and for example the H\(_2\) pressure of the gas is \(G_\mathrm{eq}\) of janaf_H2 times the H\(_2\)O pressure (src/calliope/solve.py).
Validation means that a test runs the code on a case where another source gives the right answer, and checks the result within a stated tolerance.
If a constant is wrong, the gas has the wrong ratio of H\(_2\) to H\(_2\)O, CO to CO\(_2\), or H\(_2\)S and NH\(_3\) to their parents, and the atmosphere that PROTEUS passes to the climate model is wrong.
Each case below says why the check exists, what it tests, how we know the right answer and why it matters.
A box "Test details" ends each case.
Terms used on this page.
- Oxygen fugacity \(f\mathrm{O_2}\) [bar]: a measure of how oxidising the melt is, in the form of an effective O\(_2\) pressure.
- IW buffer: the \(f\mathrm{O_2}\) at which iron metal and wüstite (FeO) are in equilibrium. \(\Delta\mathrm{IW}\) is the shift of \(f\mathrm{O_2}\) from it in log10 units. The oxygen fugacity page checks the buffers.
- \(\nu\): the exponent of the oxygen fugacity that a reaction method returns: 0.5 for
janaf_H2,janaf_COandschaefer_H, 1 forschaefer_CH4, and 0 forjanaf_SO2,janaf_H2Sandjanaf_NH3. H\(_2\)S and NH\(_3\) contain no O\(_2\). For SO\(_2\) the solve puts the O\(_2\) pressure into the SO\(_2\) pressure itself, \(\sqrt{G_\mathrm{eq}\, p_\mathrm{S_2}\, p_\mathrm{O_2}^2}\), so \(\nu\) is 0. - dex: a difference in log10 units; 0.025 dex is a factor of \(10^{0.025} \approx 1.06\).
- JANAF: the NIST-JANAF Thermochemical Tables1, tables of formation data of gases and solids against temperature.
- Cross-code check: a test that compares CALLIOPE with a second, independent code or data set.
- atmodeller: an outgassing code that PROTEUS can use in place of CALLIOPE.
- Regression check: a test that compares the code with a stored value, a result the code gave before. It fails when the result changes, but it does not show that the result is right. A set of stored values is a regression snapshot.
- \(K_f\): the formation constant of a species, from its elements in their reference states.
H2 to H2O ratio at 2000 K
Why this check exists. ModifiedKeq picks a reaction by name and combines its constant with the oxygen fugacity of a buffer. A typo in the janaf_H2 coefficients, a wrong sign of the \(f\mathrm{O_2}\) term, a wrong stoichiometric factor, a wrong buffer, or a call to the wrong reaction changes \(G_\mathrm{eq}\) without an error message.
What it tests. The test evaluates \(G_\mathrm{eq}\) of janaf_H2, for the reaction H\(_2\)O = H\(_2\) + 0.5 O\(_2\), at \(T\) = 2000 K and \(\Delta\mathrm{IW}\) = 0. \(\Delta\mathrm{IW}\) is the shift of the oxygen fugacity from the iron-wüstite (IW) buffer in log10 units; the test uses the buffer of O'Neill and Eggins (2002)2. The code gives 1.4664. The test computes the same value in closed form, \(10^{\log_{10} K - 0.5 \log_{10} f\mathrm{O_2}}\), from the coefficients and the O'Neill and Eggins buffer, and requires agreement to a relative 1e-6. It also requires that schaefer_H, the constant of Schaefer and Fegley (2017)3 for the same reaction, differs by more than 0.2 (it gives 1.2126), and that \(G_\mathrm{eq}\) lies between 0.5 and 5.
How we know the right answer. The closed form uses the published O'Neill and Eggins buffer, which the test writes out itself, and the janaf_H2 coefficients, which are a fit to the NIST-JANAF tables1 for this reaction over 1500 to 3000 K. The test does not compare the coefficients with the JANAF tables; it checks how the code combines them with the buffer.
Why it matters. The H\(_2\)/H\(_2\)O ratio of the outgassed gas comes from this constant, and the H\(_2\) pressure also enters CH\(_4\), NH\(_3\) and H\(_2\)S in the solve.
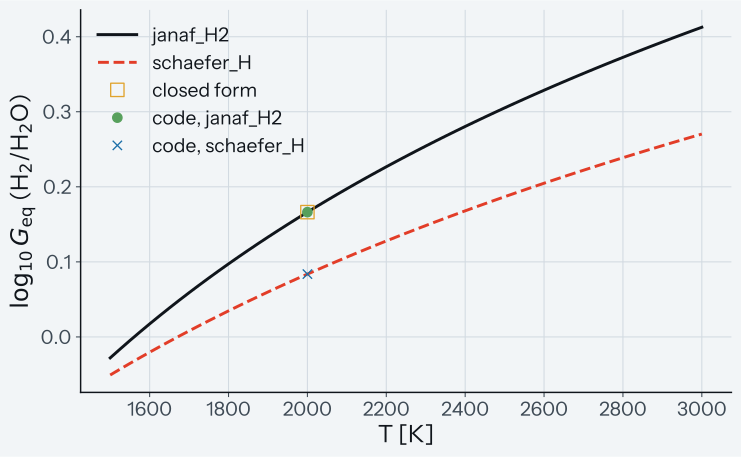
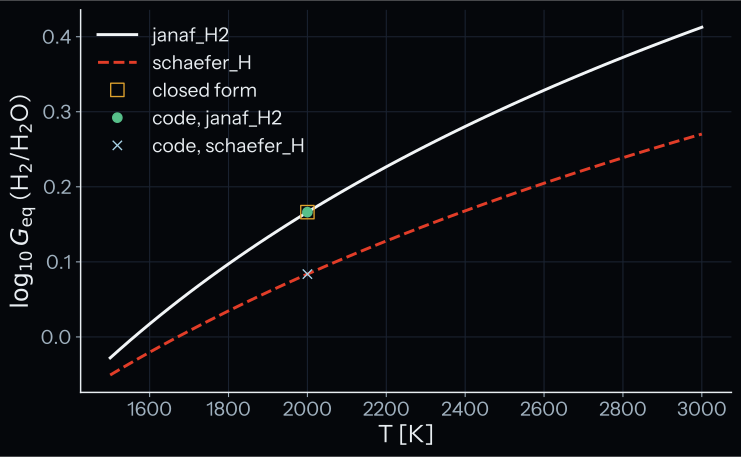
How to read the plot. The x-axis is the temperature and the y-axis is \(\log_{10} G_\mathrm{eq}\), with the O'Neill and Eggins buffer at \(\Delta\mathrm{IW}\) = 0. The lines come from ModifiedKeq and give context. The test asserts the 3 marks at 2000 K: the code value of janaf_H2 (circle), the closed form (square) and schaefer_H (cross). A pass means that the circle agrees with the square to a relative 1e-6, too small to see. The circle is at \(G_\mathrm{eq}\) = 1.466 and the cross at 1.213, so the cross lies 0.25 below the circle in \(G_\mathrm{eq}\) itself. On this log axis the gap is 0.08. The test requires a gap of more than 0.2 in \(G_\mathrm{eq}\).
Test details
- Reference: NIST-JANAF Thermochemical Tables1 (4th ed.), fits for
H2O = H2 + 0.5 O2over 1500-3000 K; O'Neill and Eggins (2002) IW buffer (closed form). - Tolerance: relative 1e-6;
schaefer_Hmust differ by more than 0.2; \(0.5 < G_\mathrm{eq} < 5\). - Test id:
tests/test_chemistry.py::test_modified_keq_janaf_H2_matches_closed_form_at_2000K_with_oneill - Command:
pytest tests/test_chemistry.py -k janaf_H2_matches_closed_form - Companion test:
test_modified_keq_fO2_model_choice_changes_resultchecks that a switch from the O'Neill to the Fischer buffer changes \(G_\mathrm{eq}\) by more than a relative 1e-6.
Worked numbers
ModifiedKeq returns Geq = 10^(Keq(T) - fO2_stoich * log10_fO2(T, dIW)).
For janaf_H2 the coefficients are (a = -13152.48, b = 3.038586, stoich = 0.5).
At T = 2000 K, fO2_model='oneill', fO2_shift = 0:
Keq = 10^(-13152.48 / 2000 + 3.038586)
    = 10^(-6.5762 + 3.0386)
    = 10^-3.5376
    ~ 2.900e-4
The O'Neill 2002 IW buffer at the same T:
log10(fO2) = 2 * (-244118 + 115.559 * 2000 - 8.474 * 2000 * ln(2000))
             / (ln(10) * 8.31441 * 2000)
           ~ -7.4078
Combining:
log10(Geq) = -3.5376 - 0.5 * (-7.4078) = 0.1663
Geq = 10^0.1663 ~ 1.467
The test builds the closed form without intermediate rounding. schaefer_H at the same T:
Keq_schaefer = 10^(-12794 / 2000 + 2.7768)
             = 10^-3.6202 ~ 2.398e-4
Geq_schaefer = 10^(-3.6202 + 3.7039) = 10^0.0837 ~ 1.213
The difference of 0.25 between the two is above the 0.2 of the test.
H2S constant against the JANAF tables
Why this check exists. janaf_H2S gives \(\log_{10} K\) of S\(_2\) + 2 H\(_2\) = 2 H\(_2\)S as \(a/T - b\), where \(a\) [K] and \(b\) are fit coefficients. A wrong coefficient, a wrong stoichiometric coefficient of S\(_2\) (1 per mole of H\(_2\)S in place of 1/2), or a fit over the wrong temperature range gives the wrong H\(_2\)S pressure.
What it tests. Per mole of H\(_2\)S, that is half of \(a/T - b\), the code's \(\log_{10} K\) must lie within 0.025 dex of the JANAF value at each of the 44 table rows from 700 to 5000 K, the 2 ends included. The JANAF value per mole is \(\log K_f(\mathrm{H_2S}) - 0.5 \log K_f(\mathrm{S_2})\), where \(K_f\) is the formation constant of a species. The largest miss of the code is 0.018 dex. To show that the test can see a wrong fit, it also checks a wrong fit that the test holds, DISCRIMINATING_FIT['H2S'], \(13462.03/T - 7.2455\): it must miss the rows by more than 0.075 dex, and it misses by up to 1.853 dex. Last, \(\log_{10} K\) must fall with \(T\), as for an exothermic reaction.
How we know the right answer. The JANAF rows of H\(_2\)S and S\(_2\) are in tools/janaf_H2S.dat and tools/janaf_S2.dat, taken from the NIST-JANAF tables1. Both tables use the same sulfur reference state, which cancels in the difference.
Why it matters. The solve sets the H\(_2\)S pressure to \(\sqrt{G_\mathrm{eq}\, p_\mathrm{S_2}\, p_\mathrm{H_2}^2}\), so a wrong constant changes the sulfur in a hydrogen-rich gas.
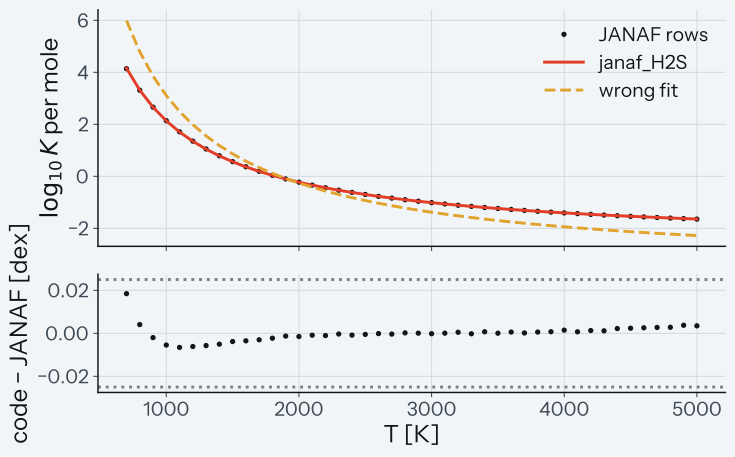
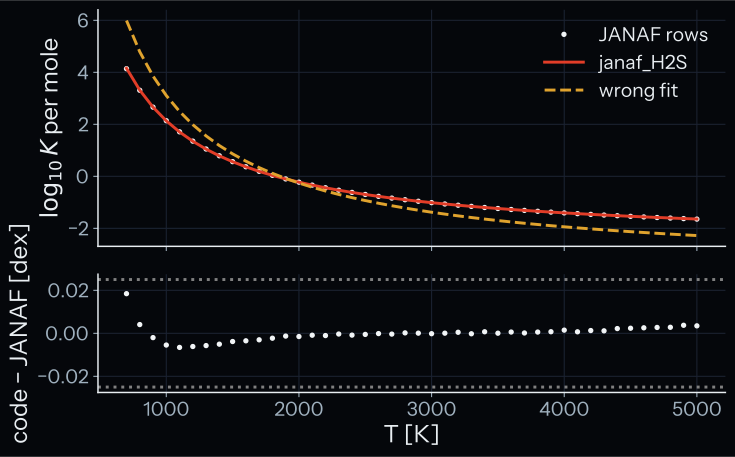
How to read the plot. The top panel shows \(\log_{10} K\) per mole of H\(_2\)S against temperature: the JANAF rows (marks), the code (solid line) and the wrong fit (dashed line). The bottom panel shows the code minus JANAF at each row, with the tolerance of 0.025 dex as dotted lines. A pass means that every residual lies between the dotted lines. The wrong fit misses the rows by up to 1.85 dex and crosses them between 1900 and 2000 K. The test requires only that its worst miss is more than 0.075 dex.
Test details
- Reference: NIST-JANAF Thermochemical Tables1 (4th ed.), log Kf of H2S and S2 in
tools/. - Tolerance: 0.025 dex at every row from 700 to 5000 K; the wrong-fit coefficients must miss by more than 0.075 dex (3 times the tolerance).
- Test id:
tests/test_chemistry.py::test_janaf_constant_matches_janaf_rows_over_fit_range[hydrogen_sulfide] - Command:
pytest "tests/test_chemistry.py::test_janaf_constant_matches_janaf_rows_over_fit_range[hydrogen_sulfide]"
H2S coefficients are a least-squares fit
Why this check exists. A change of a coefficient, of the fit range or of the fit form can keep the miss below the 0.025 dex of the case above. This case catches such a change, because the coefficients must equal the least-squares fit of the JANAF rows.
What it tests. The test fits a straight line of \(2 \log_{10} K\) against \(1/T\) to the JANAF rows from 700 to 5000 K by least squares. At every row, this line must equal the code's \(a/T - b\) to a relative and absolute 1e-6. The absolute part is needed because the H\(_2\)S value crosses zero near 1830 K.
How we know the right answer. The fit of tools/fit_H2S.ipynb over the same JANAF rows gives the coefficients; the test repeats it with numpy.polyfit.
Why it matters. A changed fit range, form or coefficient moves the fit away from the code, and this case then fails even when the change stays inside the 0.025 dex of the row test.
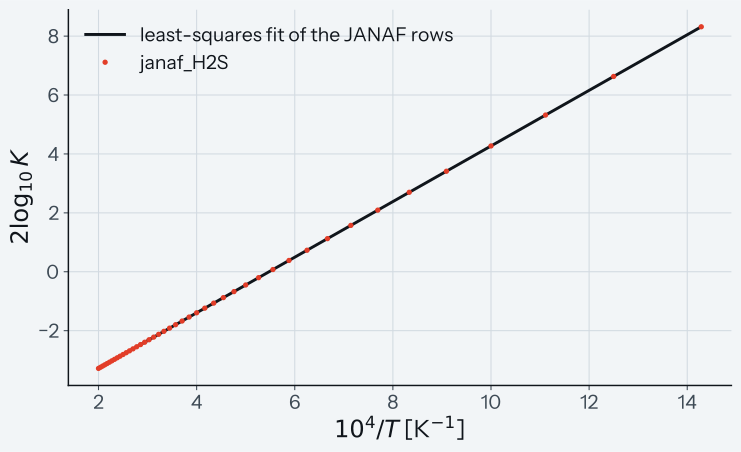
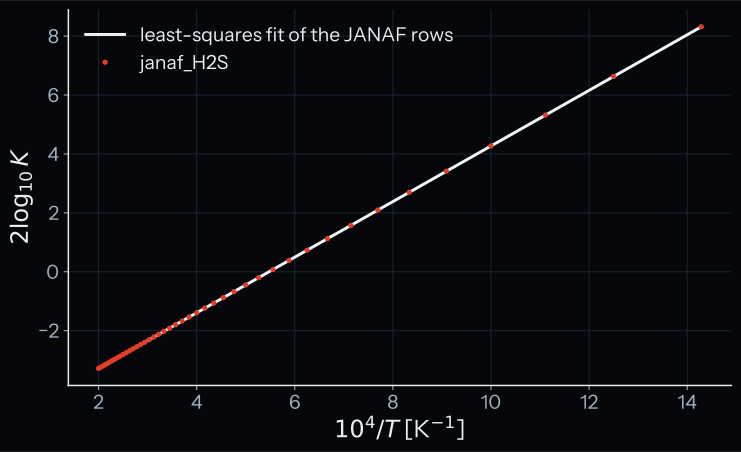
How to read the plot. The x-axis is \(10^4/T\) and the y-axis is twice \(\log_{10} K\) per mole, that is \(a/T - b\), so the law is a straight line. The line is the least-squares fit of the JANAF rows and the marks are the code at each row. The test asserts that they agree to a relative and absolute 1e-6, far below what the plot can show. A pass means that every mark sits on the line.
Test details
- Reference: the JANAF rows of the case above;
tools/fit_H2S.ipynb. - Tolerance: relative 1e-6 and absolute 1e-6 at every row.
- Test id:
tests/test_chemistry.py::test_janaf_coefficients_are_least_squares_fit_of_janaf_rows[hydrogen_sulfide] - Command:
pytest "tests/test_chemistry.py::test_janaf_coefficients_are_least_squares_fit_of_janaf_rows[hydrogen_sulfide]"
NH3 constant against the JANAF tables
Why this check exists. janaf_NH3 gives \(\log_{10} K\) of N\(_2\) + 3 H\(_2\) = 2 NH\(_3\) as \(a/T - b\), with fit coefficients \(a\) and \(b\). A wrong coefficient or fit range gives the wrong NH\(_3\) pressure.
What it tests. Per mole of NH\(_3\), the code's \(\log_{10} K\) must lie within 0.04 dex of \(\log K_f(\mathrm{NH_3})\) at every JANAF row from 700 to 5000 K (44 rows). The largest miss of the code is 0.034 dex. A wrong fit that the test holds must miss the rows by more than 0.12 dex, which shows that the test can see a wrong fit; it misses by up to 0.158 dex. \(\log_{10} K\) must fall with \(T\).
How we know the right answer. The JANAF rows of NH\(_3\) are in tools/janaf_NH3.dat, from the NIST-JANAF tables1. N\(_2\) and H\(_2\) are reference states, so \(\log K_f(\mathrm{NH_3})\) is the constant per mole of NH\(_3\).
Why it matters. The solve sets the NH\(_3\) pressure to \(\sqrt{G_\mathrm{eq}\, p_\mathrm{N_2}\, p_\mathrm{H_2}^3}\), so a wrong constant changes the nitrogen in a hydrogen-rich gas.
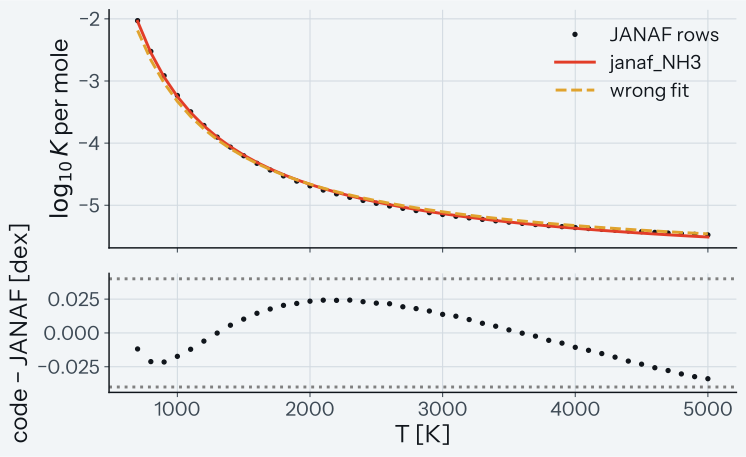
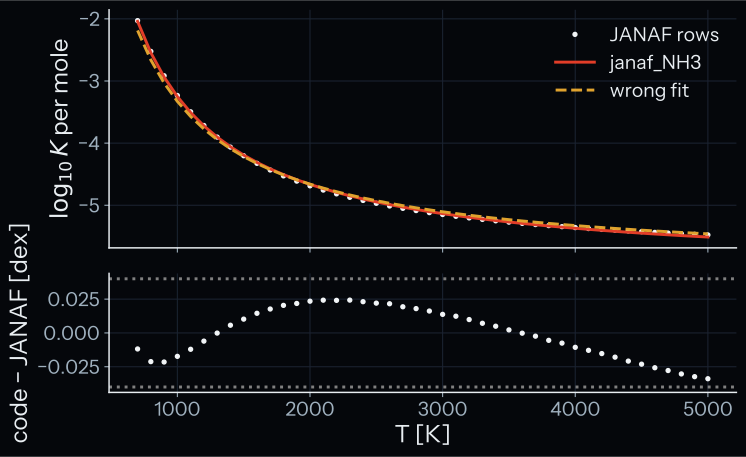
How to read the plot. The top panel shows \(\log_{10} K\) per mole of NH\(_3\) against temperature: the JANAF rows (marks), the code (solid line) and the wrong fit (dashed line). The bottom panel shows the code minus JANAF, with the tolerance of 0.04 dex as dotted lines. A pass means that every residual lies between the dotted lines. The wrong fit misses the rows by up to 0.158 dex, and at 42 of the 44 rows by less than 0.12 dex. At this scale it lies close to the solid line, and the plot does not draw its miss. The test requires only that its worst miss is more than 0.12 dex.
Test details
- Reference: NIST-JANAF Thermochemical Tables1 (4th ed.), log Kf of NH3 in
tools/. - Tolerance: 0.04 dex at every row from 700 to 5000 K; the wrong-fit coefficients must miss by more than 0.12 dex (3 times the tolerance).
- Test id:
tests/test_chemistry.py::test_janaf_constant_matches_janaf_rows_over_fit_range[ammonia] - Command:
pytest "tests/test_chemistry.py::test_janaf_constant_matches_janaf_rows_over_fit_range[ammonia]"
NH3 coefficients are a least-squares fit
Why this check exists. A change of a coefficient, of the fit range or of the fit form can keep the miss below the 0.04 dex of the case above. This case catches such a change.
What it tests. The test fits a straight line of \(2 \log_{10} K\) against \(1/T\) to the JANAF rows from 700 to 5000 K by least squares. At every row, this line must equal the code's \(a/T - b\) to a relative and absolute 1e-6.
How we know the right answer. The fit of tools/fit_NH3.ipynb over the same rows gives the coefficients; the test repeats it with numpy.polyfit.
Why it matters. A changed fit range, form or coefficient moves the fit away from the code, and this case then fails.
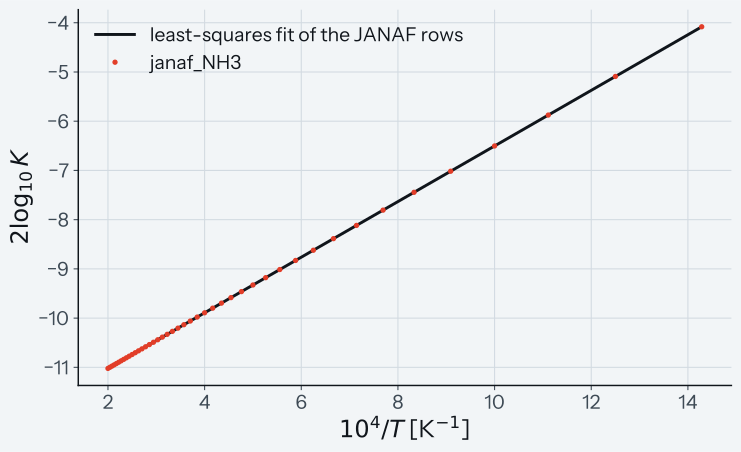
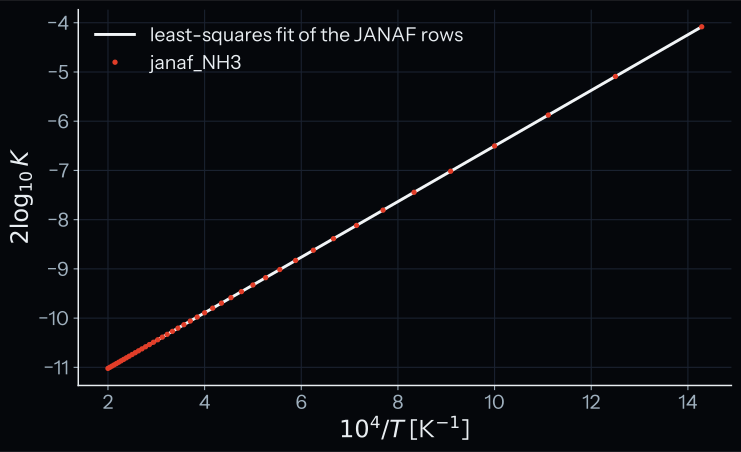
How to read the plot. The x-axis is \(10^4/T\) and the y-axis is twice \(\log_{10} K\) per mole, that is \(a/T - b\). The line is the least-squares fit of the JANAF rows and the marks are the code at each row. The test asserts agreement to a relative and absolute 1e-6, far below what the plot can show. A pass means that every mark sits on the line.
Test details
- Reference: the JANAF rows of the case above;
tools/fit_NH3.ipynb. - Tolerance: relative 1e-6 and absolute 1e-6 at every row.
- Test id:
tests/test_chemistry.py::test_janaf_coefficients_are_least_squares_fit_of_janaf_rows[ammonia] - Command:
pytest "tests/test_chemistry.py::test_janaf_coefficients_are_least_squares_fit_of_janaf_rows[ammonia]"
Six constants against NASA Glenn data
Why this check exists. A wrong coefficient of janaf_CO, janaf_SO2 or schaefer_CH4 that moves its \(\log_{10} K\) by more than 0.002 dex, a wrong O\(_2\) factor \(\nu\), or a solve that puts a constant into the wrong reaction form, gives the wrong gas. No case above checks these 3 constants. The reaction quotient \(Q\) of a reaction is the ratio of the product pressures to the reactant pressures, each to the power of its coefficient; in equilibrium it equals \(K\). The test writes each reaction per mole of product. For SO\(_2\), NH\(_3\) and H\(_2\)S the code's \(K\) is for 2 moles of product, so the test compares \(\log_{10} Q\) with \(0.5 \log_{10} K\).
What it tests. The test uses 6 constants: janaf_H2, janaf_CO, schaefer_CH4, janaf_SO2, janaf_NH3 and janaf_H2S. It uses the Fischer buffer (see the oxygen fugacity page), which is also the buffer of the comparison with atmodeller. At 1500, 2000, 2500 and 3000 K it checks:
- the O\(_2\) factor \(\nu\) of each reaction, exactly;
- \(G_\mathrm{eq}\) against \(10^{\log_{10} K - \nu \log_{10} f\mathrm{O_2}}\) to a relative 1e-12, and the ratio of \(G_\mathrm{eq}\) at \(\Delta\mathrm{IW} = +2\) and \(-2\) against \(10^{-4\nu}\), also to a relative 1e-12;
- after a solve with gas only (no melt), \(\log_{10} Q\) of each reaction, for example \(Q = p_\mathrm{H_2}\, p_\mathrm{O_2}^{0.5} / p_\mathrm{H_2O}\), against \(\log_{10}\) of the code's \(K\) per mole of product, to a relative 1e-12;
- the offset of \(\log_{10} Q\) from \(\log_{10} K_\mathrm{NASA}\), the NASA Glenn value per mole of product. Each offset must lie within 0.002 dex of a stored offset.
How we know the right answer. NASA Glenn data4 are polynomial fits of the thermodynamic properties of each species, with 9 coefficients per temperature interval; the test holds their \(\log_{10} K\) values, taken from atmodeller 1.0.2. CALLIOPE uses its own JANAF and Schaefer fits, which give a different \(\log_{10} K\) than the NASA Glenn fits. So the expected offsets are not zero: they are stored values, a regression snapshot. The largest stored offset is that of CH\(_4\), 0.100 dex at 2000 K. The checks of \(\log_{10} Q\) against the code's own \(K\), in contrast, are exact identities of the solve.
Why it matters. This case covers janaf_CO, janaf_SO2 and schaefer_CH4, which no other case on this page checks, and it records how far the chemistry of CALLIOPE lies from the data that atmodeller uses.
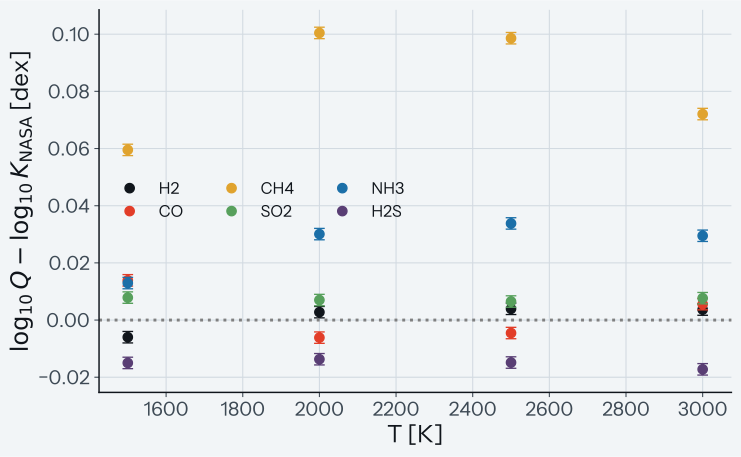
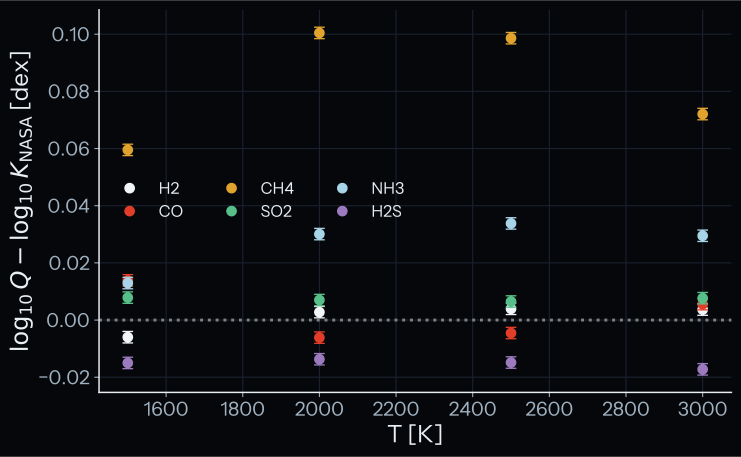
How to read the plot. Each colour is one reaction, named in the legend by its product. The x-axis is the temperature and the y-axis the offset of \(\log_{10} Q\) from the NASA Glenn value. The error bars are centred on the stored offsets and have the bound of 0.002 dex, about the size of a mark at this scale. The marks are the offsets measured in the test, and the dotted line is a zero offset. A pass means that each mark lies on its stored offset within 0.002 dex. Some marks overlap, for example CO and NH\(_3\) at 1500 K. The size of the offsets, up to 0.1 dex for CH\(_4\), is the known difference between the 2 data sets.
Known limit. The offsets from NASA Glenn are a regression snapshot: the case fails if an offset moves, but it does not say which data set is right. schaefer_C has no case. schaefer_H appears only in the first case, as the alternative constant that \(G_\mathrm{eq}\) must differ from. The test does not call atmodeller. It sits in the cross-code test file, which is skipped without atmodeller, so it runs in the nightly cross-code job.
Test details
- Reference: NASA Glenn thermodynamic data4 (cross-code check, values from atmodeller 1.0.2).
- Tolerance: exact O\(_2\) factor; relative 1e-12 for \(G_\mathrm{eq}\), the shift ratio and \(\log_{10} Q\); offset from NASA Glenn within 0.002 dex of the stored offset.
- Test id:
tests/test_cross_code_consistency.py::test_calliope_equilibrium_constants_and_reaction_quotients_vs_nasa_glenn - Command:
pytest tests/test_cross_code_consistency.py -k nasa_glenn(integration tier; skips without atmodeller)
Related code and pages
src/calliope/chemistry.py(ModifiedKeq.__init__,ModifiedKeq.__call__): constructor and modified constant.src/calliope/chemistry.py(ModifiedKeq.schaefer_*,ModifiedKeq.janaf_*): per-reaction coefficient methods.- Equilibrium chemistry: the explanation page.
References
-
M. W. Chase, NIST-JANAF Thermochemical Tables, 4th edition, Journal of Physical and Chemical Reference Data Monograph 9, 1998. ↩↩↩↩↩↩↩
-
H. St. C. O'Neill, S. M. Eggins, The effect of melt composition on trace element partitioning: an experimental investigation of the activity coefficients of FeO, NiO, CoO, MoO\(_2\) and MoO\(_3\) in silicate melts, Chemical Geology, 186, 151-181, 2002. SciX. The IW expression of the code uses the free energy of Fe + 0.5 O\(_2\) = FeO(liquid) in their Table 6, p. 163. ↩
-
L. Schaefer, B. Fegley, Redox states of initial atmospheres outgassed on rocky planets and planetesimals, The Astrophysical Journal, 843(2), 120, 2017. SciX. ↩
-
B. J. McBride, M. J. Zehe, S. Gordon, NASA Glenn Coefficients for Calculating Thermodynamic Properties of Individual Species, NASA/TP-2002-211556, NASA Glenn Research Center, 2002. ↩↩