Surface lid
What this page checks
This page checks the sub-grid surface lid, subgrid_lid = true: a conductive crust thinner than the top cell of the mesh, which Aragog carries as two extra states, the crust thickness and its energy per area. Validation here means that we run the lid on a case where the right answer is known from a textbook solution or from a run on a much finer mesh, and check that the lid gives that answer. If the lid were wrong, a run with the lid would grow its crust at the wrong rate, and the heat that leaves the planet through the crust would be wrong. Each case below says why the check exists, what it tests, how we know the right answer and why it matters, then shows a plot and the test details.
Three of the cases drive the lid functions of aragog.surface_lid through time, outside the solver. The growth law, the profile family and the rates are the ones the solver calls. The two cases that hold the surface at a fixed temperature use fixed_surface_state, which the solver calls under outer boundary 5, and the constant heat capacity of LidEnthalpy.linear, which it calls on a constant-property column. On the grey-body surface with the tables the solver uses surface_state and LidEnthalpy.table; the steady-crust case exercises the first, and the fine-mesh cases are the first to exercise both in the solver.
The material properties are constant: thermal conductivity \(k\) = 4 W/m/K, density \(\rho\) = 3000 kg/m³ and heat capacity \(c_p\) = 1200 J/kg/K, so the thermal diffusivity is \(\kappa = k / (\rho c_p)\) = 1.11 × 10⁻⁶ m²/s. The base of the lid is at \(T_b\) = 1400 K. These three check the lid on its own; the coupling of the lid to the mesh is checked by the two fine-mesh cases and by the solver tests listed at the end. Two cases check the surface of the lid under an atmosphere, the Robin surface and the onset weight, on the NumPy and JAX functions, each with its own properties.
A crust growing over melt
Why this check exists. The temperature profile across the lid sets how much heat the lid conducts away from its base, and so how fast new crust forms. The simplest choice, a straight-line profile, grows the crust 1.6, 14 and 37 % too fast at the three Stefan numbers below, and the test sees it.
What it tests. A lid lies over melt at its melting temperature \(T_b\). The melt delivers no heat to the base of the lid, and the surface is held at \(T_s\) = 300 K. The Stefan number \(\mathrm{St} = c_p (T_b - T_s) / L\) compares the heat to cool the crust with \(L\), the latent heat released when 1 kg of melt freezes; the test uses St = 0.1, 1 and 3.381. The lid starts at 10⁶ s on the textbook profile, and the test checks its thickness \(\delta\) at 10⁸, 10¹⁰ and 10¹² s. A second lid starts at 1 m with a straight-line profile and must approach the same law.
How we know the right answer. This is the Stefan problem of a solidifying lava layer: the crust thickness is \(\delta = 2 \lambda \sqrt{\kappa t}\), with \(\lambda\) the root of \(\lambda\, e^{\lambda^2} \operatorname{erf}\lambda = \mathrm{St} / \sqrt{\pi}\) (Turcotte and Schubert (2014)3 section 4.18, Eqs. 4.136 and 4.141, pp. 197-198). The roots are \(\lambda\) = 0.220, 0.620 and 0.948. The lid uses the same family of profiles as this solution. It should hold the growth law to round-off.
Why it matters. When the surface of a magma ocean starts to freeze, the crust thickness sets how much heat the planet loses, and so how fast the interior cools.
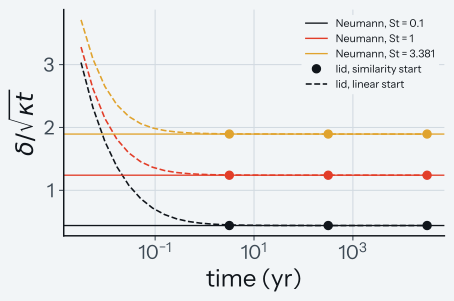
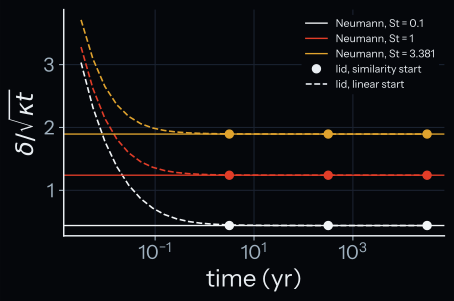
How to read the plot. The vertical axis is the crust thickness divided by \(\sqrt{\kappa t}\), which is constant, \(2\lambda\), on the textbook solution. The horizontal lines are \(2\lambda\) for each Stefan number, and the dots are the lid at the three test times. The dots lie on the lines. The dashed curves are the lids that start at 1 m: they start too thick for their age and reach the lines within a few years.
Test details
- Reference: Turcotte and Schubert (2014)3 section 4.18, Eqs. 4.136 and 4.141 (pp. 197-198).
- Tolerance: relative 10⁻² at each test time (measured: 2.5 × 10⁻¹²); the test also checks 10⁻⁸. The lid that starts at 1 m is within 10⁻² after 7.6, 1.4 and 0.47 years at St = 0.1, 1 and 3.381.
- Discrimination: the straight-line growth law \(\delta = \sqrt{2\, \mathrm{St}\, \kappa t}\) misses the reference by 1.6, 14 and 37 %.
- Test id:
tests/test_surface_lid_neumann.py::test_v1_crust_growth_follows_neumann - Command:
pytest tests/test_surface_lid_neumann.py(add--validation-plotsto write the plot pair)
A cooling solid without latent heat
Why this check exists. Without latent heat, the lid must behave as a solid that cools from its surface. A wrong surface slope of the profile gives the wrong heat flux. A flux twice the right one lies far outside the tolerance.
What it tests. The same lid, with the latent heat at the small floor the solver keeps (10³ J/kg), so the Stefan number is 1320. The surface is held at 300 K, the base at 1400 K. The test compares the heat flux through the surface with the textbook flux from 0.095 to 31,700 years.
How we know the right answer. A half-space that starts at \(T_b\), with its surface held at \(T_s\), loses heat at the rate \(F = k (T_b - T_s) / \sqrt{\pi \kappa t}\) (Turcotte and Schubert (2014)3 section 4.15, Eq. 4.116, p. 189). At this Stefan number the lid profile is the half-space profile cut at the depth \(2 \lambda \sqrt{\kappa t}\) with \(\lambda\) = 2.40, so the lid flux is higher by the factor \(1 / \operatorname{erf}\lambda\), a relative 7.0 × 10⁻⁴.
Why it matters. Once a crust has frozen through, it cools as a solid; this sets the late heat loss of a planet with a stagnant lid.
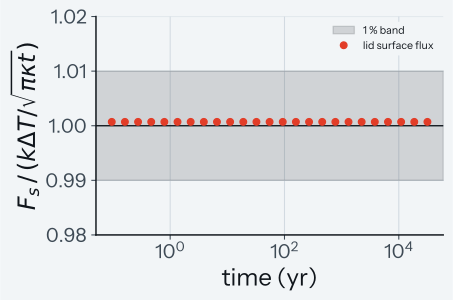
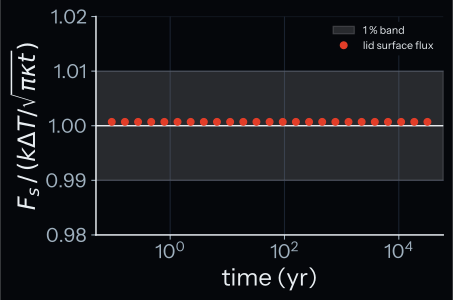
How to read the plot. The vertical axis is the surface flux of the lid divided by the half-space flux; the shaded band is the tolerance of ±1 %. The dots stay at 1.0007, the small offset that the depth of the lid explains, inside the band at all times.
Test details
- Reference: Turcotte and Schubert (2014)3 section 4.15, Eq. 4.116 (p. 189).
- Tolerance: relative 10⁻² at 25 times from three lid-diffusion times after the start (measured: 7.0 × 10⁻⁴).
- Discrimination: the lid flux misses twice the half-space flux by more than 40 % at every time.
- Test id:
tests/test_surface_lid_validation.py::test_v2_half_space_cooling - Command:
pytest tests/test_surface_lid_validation.py -k v2(add--validation-plotsto write the plot pair)
A crust in steady state
Why this check exists. Under a constant heat flux from below, a crust must settle at the thickness where it conducts exactly that flux. A lid whose growth law or surface balance is wrong settles at the wrong thickness, or its profile stays curved; the test sees both.
What it tests. The melt below delivers a constant flux \(F_b\) = 100 W/m² to the base of the lid. The surface radiates as a black body to an equilibrium temperature of 255 K, and the latent heat is 4 × 10⁵ J/kg. The lid starts 10 m thick, and the test checks it after ten relaxation times \(\tau = \max(\rho L \delta_\mathrm{eq}^2 / (k \Delta T),\ \delta_\mathrm{eq}^2 / \kappa)\). Here the diffusion time \(\delta_\mathrm{eq}^2 / \kappa\) sets \(\tau\) = 57 years; the latent-heat time is 17 years.
How we know the right answer. In steady state the crust conducts the base flux with a straight-line profile, so its thickness is \(\delta_\mathrm{eq} = k (T_b - T_s) / F_b\), with the surface temperature \(T_s\) set by the radiation balance \(\sigma (T_s^4 - T_\mathrm{eq}^4) = F_b\): \(T_s\) = 278.2 K and \(\delta_\mathrm{eq}\) = 44.87 m. This follows from the conservation of energy alone.
Why it matters. A lid on a convecting magma ocean sits close to this balance while it stays at the surface, so the crust thickness and the surface temperature of a run with the lid depend on it.
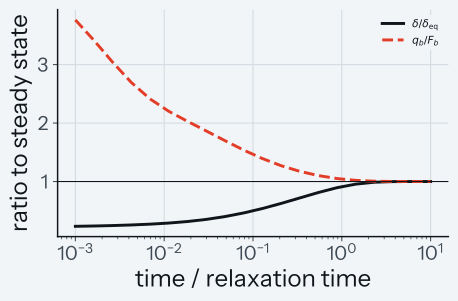
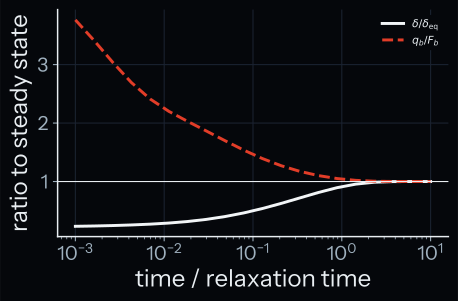
How to read the plot. The horizontal axis is time divided by the relaxation time. The solid line is the lid thickness and the dashed line the heat conducted into the base of the lid, both divided by their steady values. The thin lid first conducts too much heat and grows; both lines stay inside 1 % of 1 from 2.5 relaxation times on.
Test details
- Reference: energy balance of a steady conductive crust under a grey-body surface.
- Tolerance: thickness and base flux to a relative 10⁻⁴ after ten relaxation times, shape parameter \(|s| < 10^{-3}\) (measured: 2.1 × 10⁻⁷, 8.8 × 10⁻⁸ and 1.7 × 10⁻⁷).
- Test id:
tests/test_surface_lid_validation.py::test_v3_quasi_steady_crust - Command:
pytest tests/test_surface_lid_validation.py -k v3(add--validation-plotsto write the plot pair)
A cooling solid shell on a fine mesh
Why this check exists. The three cases above drive the lid functions alone, outside the solver. This case runs the lid inside the solver, where the heat content of the crust comes from the equation of state, and compares it with the solver's own conduction on a mesh fine enough to resolve the crust. The test runs the lid again only when ARAGOG_LOWT_EOS_DIR names the extended table; without it, as on CI, it compares the stored runs, and test_v2_lid_run_on_the_test_tables pins the lid run on the test tables to its stored values at a relative 10⁻⁶.
What it tests. A solid shell 25 km thick starts at 1300 K, below the solidus (1421 K at the surface), and cools by conduction only through a black-body surface that radiates to 255 K. The solid rheology is on with the 'local' closure and a fixed lid_base_temperature of 1300 K, so the lid base sits at the temperature of the top cell from the first step: the heat jump is 0 and the lid grows at the floor of 10³ J/kg (see the Explanation). Without the solid rheology a start below the solidus hands over before the first step, and the lid does nothing.
One run uses 10 nodes (cells of 2.8 km) with the lid; the other uses 4000 nodes (cells of 6.25 m) without the lid. The test compares their surface fluxes at 8 times from 300 to 5000 years. The surface of the fine mesh cools below 300 K, below the floor of the SPIDER test tables (about 320 K), so both runs use the PALEOS table extended to 67 K (md5 of temperature_solid.dat: 18d6f9eb5ba654d58fe3fad30ce118f0).
How we know the right answer. At 300 years the cooled layer is about 97 m thick, 15 cells of the fine mesh, so the fine mesh resolves the crust that the lid replaces. Runs on 500, 1000 and 4000 nodes estimate the error of the fine mesh itself: the change from 1000 to 4000 nodes is 1.79 % at 300 years and falls to 0.17 % at 5000 years.
| time (yr) | lid / 4000 nodes | estimated error of the 4000-node mesh |
|---|---|---|
| 300 | 1.0046 | 1.79 % |
| 448 | 1.0038 | 1.30 % |
| 670 | 1.0036 | 0.92 % |
| 1002 | 1.0035 | 0.71 % |
| 1497 | 1.0034 | 0.46 % |
| 2238 | 1.0034 | 0.36 % |
| 3345 | 1.0034 | 0.24 % |
| 5000 | 1.0033 | 0.17 % |
Why it matters. The lid exists so that a coarse mesh loses heat as a fine one would. Without the lid, the 10-node shell loses only 8 to 30 % of the heat the fine mesh loses over these times.
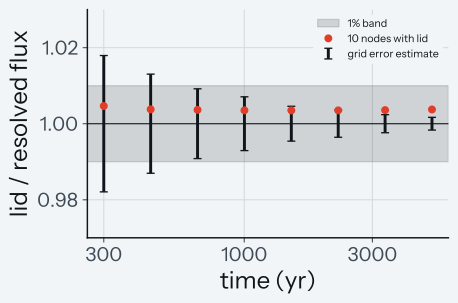
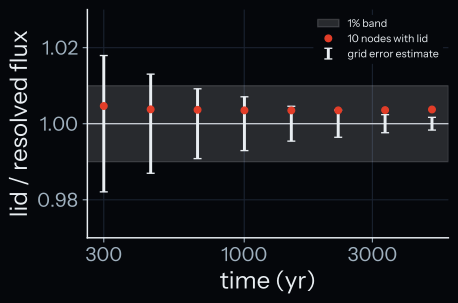
How to read the plot. The dots are the surface flux of the shell with the lid divided by that of the fine mesh; the shaded band is the tolerance of ±1 %. The bars show the estimated error of the fine mesh itself: long at early times, when the cooled layer is thin, and short later. The dots sit 0.3 to 0.5 % above 1, inside the band. Until about 2000 years they also lie inside the bars; later the bars are shorter than the offset of 0.3 %, which is then the difference of the lid itself.
Test details
- Reference: the 4000-node solver run without the lid, stored in
tests/reference/surface_lid_v2_grid.npzbytests/reference/build_surface_lid_v2_grid.py. - Tolerance: relative 10⁻² at each time (measured: 3.3 × 10⁻³ to 4.6 × 10⁻³).
- Discrimination: the 10-node shell without the lid misses by more than 10 %.
- Test id:
tests/test_surface_lid_v2_grid.py::test_v2_lid_matches_the_resolved_mesh; on the SPIDER test tables::test_v2_lid_run_on_the_test_tablesreruns the lid shell against a stored pin. - Command:
pytest tests/test_surface_lid_v2_grid.py(setARAGOG_LOWT_EOS_DIRto the extended table to repeat the lid run on it; add--validation-plotsto write the plot pair)
A shell freezing from the mush on a fine mesh
Why this check exists. Here the crust grows by freezing melt, so the lid takes up the heat the melt releases as it joins the crust, latent heat included: the Stefan jump. A wrong jump grows the crust at the wrong rate. As above, the test runs the lid again only with the extended table; on CI test_v2_melt_lid_run_on_the_test_tables pins the lid run on the test tables to its stored values at a relative 10⁻⁶.
What it tests. The shell of the case above, 25 km thick, starts in the mush: at every node the entropy lies a fifth of the way from the solidus to the liquidus. The solid rheology is off, so the base of the crust is the solidus. The shell cools by conduction only through a black-body surface that radiates to 255 K, on the same extended PALEOS table. One run uses 10 nodes with the lid; the other uses 4000 nodes (cells of 6.25 m) without the lid. The test compares the surface flux and the crust thickness at 8 times from 100 to 5000 years. For the lid the crust thickness is the thickness of the lid; for the fine mesh it is the depth where the entropy first reaches the solidus.
How we know the right answer. At 100 years the crust of the fine mesh is 126 m thick, 20 of its cells, and at 5000 years 890 m. A run on 1000 nodes estimates the error of the fine mesh: the change from 1000 to 4000 nodes is 4.1 % in the flux and 4.6 % in the crust at 100 years, and falls to 0.2 % at 5000 years. Two 1000-node runs whose start entropies differ by one part in 10¹² agree to 1.6 × 10⁻⁶, so round-off does not limit the comparison.
| time (yr) | crust of the fine mesh (m) | flux, lid / 4000 nodes | crust, lid / 4000 nodes | estimated error of the fine mesh, flux | estimated error of the fine mesh, crust |
|---|---|---|---|---|---|
| 100 | 126 | 1.0070 | 0.9920 | 4.11 % | 4.62 % |
| 175 | 167 | 1.0041 | 0.9899 | 2.72 % | 2.84 % |
| 306 | 220 | 1.0018 | 0.9933 | 2.14 % | 1.49 % |
| 535 | 292 | 1.0003 | 0.9926 | 1.40 % | 0.96 % |
| 935 | 386 | 0.9995 | 0.9939 | 0.94 % | 0.82 % |
| 1635 | 510 | 0.9989 | 0.9950 | 0.61 % | 0.37 % |
| 2859 | 674 | 0.9982 | 0.9963 | 0.34 % | 0.02 % |
| 5000 | 890 | 0.9973 | 0.9978 | 0.23 % | 0.20 % |
Why it matters. Where a crust forms at the surface of a magma ocean, it grows this way. In a run on a coarse mesh, the crust thickness and the heat the planet loses through it depend on the Stefan jump of the lid. Without the lid, the 10-node shell misses the flux of the fine mesh by 28 % or more and makes its crust 4.4 to 30 times too thick.
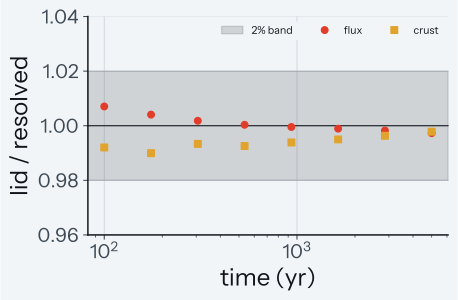
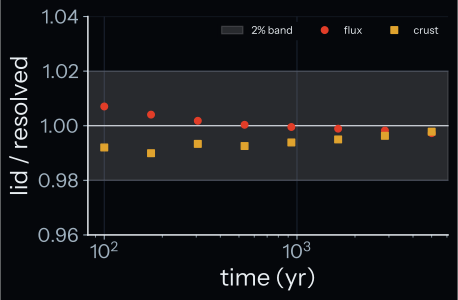
How to read the plot. The horizontal axis is time in years. The circles are the surface flux and the squares the crust thickness of the 10-node shell with the lid, each divided by the value of the 4000-node shell. The shaded band is the tolerance of ±2 %. Early on the lid loses up to 0.7 % more heat and its crust is up to 1.0 % thinner; both ratios approach 1 as the crust grows. All points lie inside the band; the error of the fine mesh itself is in the table above.
Test details
- Reference: the 4000-node solver run without the lid, stored with a 1000-node run and its round-off member in
tests/reference/surface_lid_v2_melt.npzbytests/reference/build_surface_lid_v2_melt.py. - Tolerance: relative 2 × 10⁻² at each time for the flux and the crust (measured: 7.0 × 10⁻³ and 1.0 × 10⁻²); the round-off member within 10⁻⁵ (measured 1.6 × 10⁻⁶).
- Discrimination: the 10-node shell without the lid misses both quantities by more than 25 %.
- Test id:
tests/test_surface_lid_v2_grid.py::test_v2_melt_lid_matches_the_resolved_mesh; on the SPIDER test tables::test_v2_melt_lid_run_on_the_test_tablesreruns the lid shell against a stored pin. - Command:
pytest tests/test_surface_lid_v2_grid.py -k melt(setARAGOG_LOWT_EOS_DIRto the extended table to repeat the lid run on it; add--validation-plotsto write the plot pair)
A molten shell freezing through on a fine mesh
Why this check exists. A shell that starts fully molten cools fast at its surface. On a coarse mesh the top cell freezes through within a few years, long before a resolved crust would be thick. Without the solid rheology the lid base is the solidus, so once the top cell is at the solidus no melt is left below the lid to freeze. A lid kept past that point keeps a crust the mesh no longer has: with the hand-over held off, the lid gives between 0.26 and 50 times the surface flux of the fine mesh. The test runs the 10-node shell again, with and without the lid, only with the extended table.
What it tests. The shell of the cases above, 25 km thick, starts molten: at every node the entropy lies 1.1 times the way from the solidus to the liquidus. It convects, the solid rheology is off, and it cools through a black-body surface that radiates to 255 K, on the extended PALEOS table. One run uses 10 nodes (top cell 2.8 km) with the lid; the reference uses 800 nodes without the lid, with a top cell of 0.125 m. The test compares their surface fluxes at 29 times from 100 to 5000 years.
The 10-node lid hands over to the mesh at 7.9 years, when its top cell cools through the solidus; from then on it equals the 10-node shell without the lid to 3.0 × 10⁻⁶. So this case checks the hand-over and the coarse mesh after it, not a lid that lives long: the first comparison comes after the hand-over, so the lid itself has no measured error before 7.9 years.
The criterion of the hand-over is tested in tests/test_subgrid_lid_solver.py::test_lid_hands_over_where_the_top_cell_freezes. The hand-over time also has its own check: the top cell of the stored 10-node run without the lid, which does not use the lid code, cools through the solidus 3.5 × 10⁻⁵ later on the extended table (2.5 × 10⁻⁵ on the test tables), well inside the tolerance of 5 × 10⁻⁴. The flux of this case does not see the heat content of the merge; tests/test_subgrid_lid_solver.py::test_merge_is_energy_exact checks that.
How we know the right answer. The reference mesh is refined towards the surface in radius coordinates. A run on 400 nodes with a top cell of 0.25 m agrees with it to 5.7 × 10⁻⁵ at all 29 times, which estimates the error of the reference. A run on 1000 nodes with uniform cells of 25 m is not the reference, because its value at 5000 years changes when its start entropy changes by one part in 10¹². Runs on 2000 and 4000 nodes with uniform cells did not reach their first output at 100 years.
The 10-node lid lies within 3 % of the reference at every time: 0.95 % above it at 100 years, and 2.1 % below it at 5000 years. With the solid rheology off, the floor of the eddy diffusivity sets \(\kappa_h\) = 0.048 m²/s at every node of the 10-node shell at 5000 years, so the floor carries its heat flux.
Why it matters. A run from a molten start whose surface freezes on a coarse mesh passes through this stage. The lid must step aside once the coarse mesh can carry the cold top cell; otherwise it keeps a crust that is no longer there, and in this case the surface flux at 5000 years is 50 times that of the fine mesh.
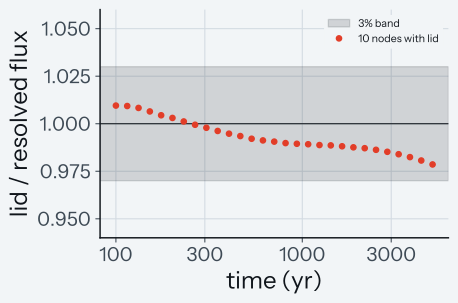
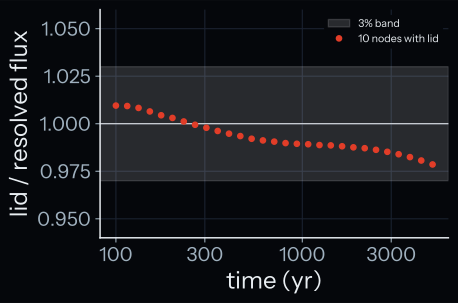
How to read the plot. The horizontal axis is time in years. The dots are the surface flux of the 10-node shell with the lid divided by that of the 800-node reference. The shaded band is the tolerance of ±3 %. The dots start 1 % above the reference and fall slowly to 2 % below it; all lie inside the band. The estimated error of the reference, 5.7 × 10⁻⁵, is too small to show.
Test details
- Reference: the 800-node run without the lid (top cell 0.125 m) and the 400-node run (top cell 0.25 m), stored from their row files with md5 and code commit, with the 10-node runs with and without the lid and the 10-node lid with its hand-over held off, in
tests/reference/surface_lid_c3_molten.npzbytests/reference/build_surface_lid_c3_molten.py. - Tolerance: relative 3 × 10⁻² at each time against the 800-node run (measured 2.1 × 10⁻²); the 400-node run against it within 10⁻⁴ (measured 5.7 × 10⁻⁵); the lid against the 10-node run without the lid within 10⁻⁵ (measured 3.0 × 10⁻⁶); the hand-over time within 5 × 10⁻⁴ of the crossing of the solidus without the lid (measured 3.5 × 10⁻⁵).
- Reruns: on the test tables the flux pin holds to 3 × 10⁻⁵ and the hand-over time to 10⁻⁵. Seven starts spread that flux by 2.3 × 10⁻⁶ on Apple M1 Ultra and 2.1 × 10⁻⁶ on AMD EPYC 7763; the rest of its tolerance is room for a CPU not measured; on the extended table the rerun holds the flux to 10⁻⁵ and the hand-over time to 3 × 10⁻⁴.
-
Solver tolerance: three starts that differ by a relative 10⁻¹³ spread the hand-over time by the values below, at the default tolerance of the pins and at
rtol=atol= 10⁻⁸.Tables CPU Default 10⁻⁸ test Apple M1 Ultra 4.2 × 10⁻⁷ 1.3 × 10⁻⁹ test AMD EPYC 7763 2.6 × 10⁻⁷ 7.9 × 10⁻⁹ extended Apple M1 Ultra 7.9 × 10⁻⁵ 4.8 × 10⁻⁹ extended AMD EPYC 7763 2.4 × 10⁻⁶ 1.9 × 10⁻⁸ -
Sample: the values depend on the machine and on the size of the sample. The first two of these starts alone give 1.3 × 10⁻⁷ and 1.1 × 10⁻⁸ on the test tables at the default tolerance, on the same two machines.
tests/reference/surface_lid_c3_handover_spread.jsonstores these runs, with eight starts each. - Spread test:
::test_c3_handover_spread_at_two_solver_tolerancesprints these values. It holds bounds: 10⁻⁵ and 10⁻⁷ on the test tables, 3 × 10⁻⁴ and 10⁻⁶ on the extended table. It also holds that the default spread is above 0 and that the two tolerances differ by more than 10⁻¹⁰ in at least one of the three times; it does not hold the order of the two spreads. - Cause: we infer that the start shift changes the step sequence of the solver; no run shows this.
- Discrimination: with the hand-over held off, the lid misses the reference flux by more than 50 % at some time.
- Test id:
tests/test_surface_lid_v2_grid.py::test_c3_molten_lid_matches_the_resolved_mesh; on the SPIDER test tables::test_c3_molten_lid_run_on_the_test_tablesreruns the lid shell against a stored pin and checks its hand-over. - Command:
pytest tests/test_surface_lid_v2_grid.py -k c3(setARAGOG_LOWT_EOS_DIRto the extended table to repeat the 10-node runs with and without the lid on it; add--validation-plotsto write the plot pair)
The lid base at the melt temperature: mesh and floor
This section is a sensitivity study with no reference, not a validation case.
Why this check exists. Below the rheological transition the lid base is capped at the melt temperature. At the cap the Stefan jump is 0 and the lid grows at the floor of 10³ J/kg (see the Explanation), so the late crust depends on the floor and on the mesh. This check measures by how much.
What it tests. A mantle shell 1000 km thick (radius 5371 to 6371 km) starts hot, at a uniform entropy of 9466 J/kg/K, on the extended PALEOS table. The solid rheology is on with the 'lid' closure, and the surface radiates as a black body to 273 K. The lid starts 0.5 m thick. The run goes to 4 × 10⁵ years on 100, 200 and 400 nodes with the floor at 10³ J/kg, and on 100 nodes with the floor at 10² and 10⁴ J/kg. A second 100-node run starts from an entropy changed by one part in 10¹²; it sets the round-off scale of the comparison.
What we know. At 3 × 10⁵ years going from 200 to 400 nodes changes the lid thickness by a factor of 1.024, against 1.341 from 100 to 200 nodes. Earlier the step from 200 to 400 nodes is at most 1.13 from 3 × 10³ to 2 × 10⁵ years, and 2.27 at 10³ years, where the lid on 200 nodes is still at its phantom thickness of 0.5 m. At 4 × 10⁵ years it depends on the mesh. Going from 200 to 400 nodes changes it by a factor of 1.448, and the order is not monotone: the lid is 366.6 m thick on 100 nodes, 244.0 m on 200 nodes and 353.4 m on 400 nodes. The interior temperature of the 'lid' closure at that time is 1587.2 K on 100 nodes, 1864.9 K on 200 nodes and 1879.3 K on 400 nodes.
The floor changes the lid most at late times. Up to 3 × 10⁵ years the runs with the floor at 10² and 10⁴ J/kg agree with the run at 10³ J/kg to 3.2 × 10⁻² (the largest difference, at 10⁴ years). At 4 × 10⁵ years the floor of 10⁴ J/kg gives a lid of 1779.8 m, 4.854 times the lid at 10³ J/kg; the floor of 10² J/kg gives 361.8 m, a factor of 0.987. The two runs from starts one part in 10¹² apart agree to 3.1 × 10⁻⁴.
| step | 3 × 10⁵ years | 4 × 10⁵ years |
|---|---|---|
| 100 to 200 nodes | 1.341 | 1.502 |
| 200 to 400 nodes | 1.024 | 1.448 |
The step factor is the larger of the two lid thicknesses divided by the smaller one.
Why it matters. From 3 × 10³ to 3 × 10⁵ years a run of this kind gives a crust thickness that changes by up to 13 % from 200 to 400 nodes (2.4 % at 3 × 10⁵ years); up to 3 × 10⁵ years it changes by up to 3.2 % with the floor. Later the crust thickness is a result of the floor and the mesh, not of a latent heat. Read it as an estimate with the spread given here.
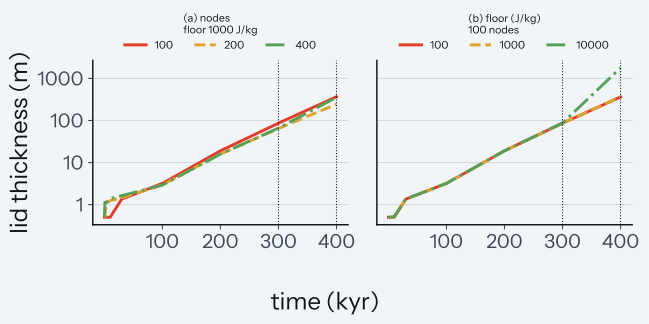
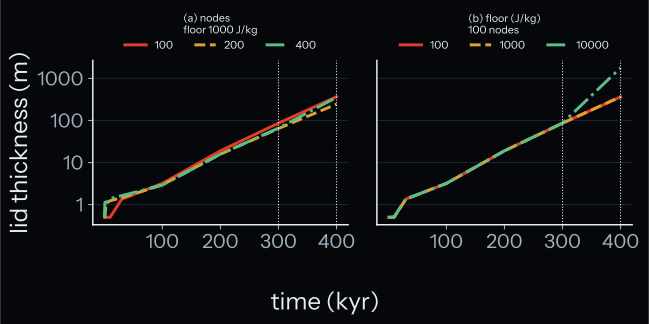
How to read the plot. The horizontal axis is time in thousands of years, the vertical axis the lid thickness on a log scale. The runs were sampled at 0.1, 1, 3, 10, 30, 100, 200, 300 and 400 thousand years; the lines join the samples. The dotted lines mark 300 and 400 thousand years. Panel (a) shows the three meshes with the floor at 10³ J/kg, panel (b) the three floors on 100 nodes. In panel (b) the lines of 10² and 10³ J/kg lie on top of each other at all times.
Test details
- Reference: the lid thickness of the six runs at the nine sample times in
tests/reference/surface_lid_base_cap.npz, collected bytools/verification/run_surface_lid_case.py --collectfrom one run per case of the same script. - Tolerance: the round-off pair within 10⁻³ (measured 3.1 × 10⁻⁴); at 3 × 10⁵ years the step from 200 to 400 nodes below 1.2 and the step from 100 to 200 nodes above it; at 4 × 10⁵ years both steps above 1.4 and the 200-node lid the thinnest; the floor runs within 4 × 10⁻² of the 10³ J/kg run up to 3 × 10⁵ years (measured 3.2 × 10⁻²); at 4 × 10⁵ years the lid with the floor of 10⁴ J/kg more than 2 times thicker (measured 4.854).
- Test id:
tests/test_surface_lid_base_cap.py::test_lid_base_cap_on_the_mesh_and_the_floor - Command:
pytest tests/test_surface_lid_base_cap.py(add--validation-plotsto write the plot pair)
The lid on the stagnant-lid benchmarks
Why this check exists. Once the lid has handed its crust to the mesh, a run with the lid must reach the steady state of the same run without it. The stagnant-lid benchmark rows run a convecting mantle under a fixed surface temperature for a long time until it is steady, and the first compared output comes at least 200 times later than the hand-over. So these rows show that the lid hands over and that the steady state stays; the steady state alone does not show that the heat of the lid was right (see the wrong-lid runs below).
What it tests. The 12 rows with \(n = 1\) of Korenaga (2009)2 Table 1 and 24 of the 25 spherical rows of Deschamps and Vilella (2021)1 Table 1 (which row is left out) run in the steady-state runner of Solid-state convection at the calibration point (0.25, 0.25) on 100 nodes, with constant properties and a fixed surface temperature.
Each row runs 3 ways: without the lid with the 'local' closure (the calibrated runs), without the lid with the 'lid' closure, and with the lid with the 'lid' closure. The lid on a constant-property column needs the 'lid' closure; with 'local' it is refused.
In these rows the yield stress is 10³⁰ Pa and the column takes the top slope of each row from that point and sets c_theta = 0 in its rheology, so both closures give the diffusion-creep viscosity: the 'lid' closure only supplies the isotherm at the base of the lid. The test compares each row with and without the lid under the 'lid' closure: the Nusselt number and the interior temperature for Korenaga (2009), and \(T_m\), \(\Phi_\mathrm{top}\), \(\Phi_\mathrm{bot}\) and the lid thickness \(d_\mathrm{lid}\) for Deschamps and Vilella (2021).
How we know the right answer. The lid models a crust thinner than the top cell. Once the crust is thicker, the mesh carries it and the lid hands over, so the right answer is the same row without the lid. The lid hands over between 8.5 × 10⁶ and 2.4 × 10⁷ years in the Korenaga (2009) rows and between 7.0 × 10⁶ and 1.0 × 10⁷ years in the Deschamps and Vilella (2021) rows, before the first output at 5 × 10⁹ years.
The largest relative change of an observable is 1.2 × 10⁻⁸ (row E300) and 8.2 × 10⁻¹³, inside the tolerance of 10⁻⁷. The counts of the benchmark comparison do not change: 0 of the 12 Korenaga (2009) Nusselt numbers lie outside 10 %, and 34 of the 72 Deschamps and Vilella (2021) values lie outside their published tolerances (0.03 in \(T_m\), 15 % in \(\Phi_\mathrm{top}\), 20 % in \(d_\mathrm{lid}\)), the same in all 3 ways.
Two energy checks run on every solver call of the runs with the lid; both runners use rtol = atol = 10⁻⁶. The gross ledger compares the change of the heat content with the time integral of the surface, core and heating powers, over the sum of their absolute values; it closes to 10⁻⁴ (largest 1.9 × 10⁻⁵, in the first call of a Deschamps and Vilella row, from the time integration of the start transient: 9.0 × 10⁻⁷ at 100 times tighter tolerances, round-off from the 14th call on). The heat change of the lid is a small part of that sum, 2.6 × 10⁻⁷ in a call of row E230a, so the gross ledger cannot see a fault of the lid.
The lid sub-ledger can: in each call that starts with the lid, the change of the heat of the lid over the melt it replaces, \(X = A (E - W(S_f)\, \delta)\), must equal the time integral of its rate to 10⁻². The largest miss is 1.2 × 10⁻³; the trapezoid rule in time sets this value, which falls with the tolerance. A lid heat change 10 % too large gives 9.0 × 10⁻² in the same row.
Before the hand-over the Stefan jump of the lid lies below its floor of 10³ J/kg in 24 to 31 % of the checked steps of a Korenaga (2009) row (432 to 1256 of 1814 to 4012 steps) and in 12 to 13 % of a Deschamps and Vilella (2021) row (169 to 192 of 1437 to 1466 steps); the lid then grows at the rate of the floor. All these steps lie before the hand-over, so the floor does not reach the steady states that the rows compare. In row f70_15p8_1e7_H3 the growth stop at 0.8 of the top cell starts to slow the lid after 4.0 × 10⁵ years, with the lid at 0.975 of the stop, and the solver warns at that time. The lid reaches the stop after 5.5 × 10⁵ years and stays there until it hands over at 7.8 × 10⁶ years.
What a wrong lid does here. Three runs of row E280b, the Korenaga (2009) row that hands over first, use a wrong lid, and a fourth uses the correct lid. The faults are the lid conductivity 1.1 times too large, or heat added to the top cell at the merge, 10 % or 100 % of the lid energy (38 K or 376 K in the top cell). The Nusselt number and the interior temperature then differ from the run without the lid by at most 3.7 × 10⁻¹¹, against 3.5 × 10⁻¹¹ with the correct lid, so the compared values do not see these faults.
The checks on the way there do: with 10 % and 100 % the gross ledger reaches 1.9 × 10⁻⁴ and 1.9 × 10⁻³ (6.8 × 10⁻⁷ with the correct lid, limit 10⁻⁴), and with the wrong conductivity the hand-over comes 2.2 % earlier and the lid sub-ledger rises from 1.6 × 10⁻⁴ to 2.8 × 10⁻⁴, inside its limit. So the rows that run again also pin the hand-over time to 10⁻⁴.
Why it matters. The rows are steady stagnant-lid convection, the regime the lid closure is made for. They show that the lid can be on in such a run and leave its steady state unchanged. They do not test the lid against a published value: the published comparison is that of the column itself, the counts above, on Solid-state convection.
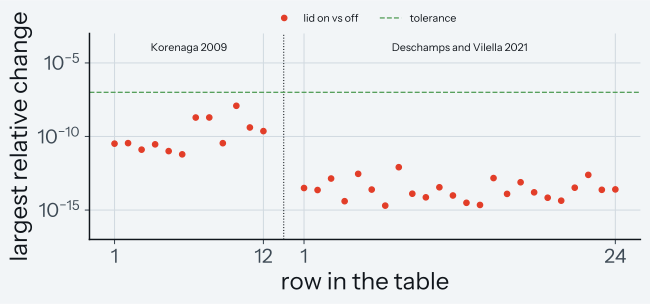
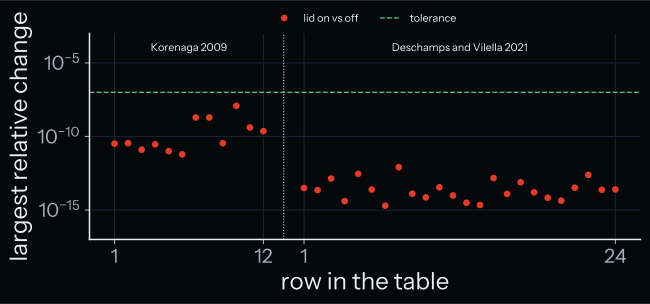
How to read the plot. The horizontal axis is the row in the order of its table, Korenaga (2009) on the left and Deschamps and Vilella (2021) on the right of the dotted line. Each dot is the largest relative change of an observable of the row from the run without the lid to the run with it, both with the 'lid' closure. The dashed line is the tolerance. All dots lie at least 8 times below the tolerance.
Test details
- Reference: the 36 rows, each run 3 ways, in
tests/reference/surface_lid_v5_rows.json(fieldmeta.commitnames the code), written bytools/verification/run_surface_lid_v5_rows.py collectfrom runs of one clean commit; the runs without the lid and with the'local'closure must equaltests/reference/ssc_mlt_top_slope_calibration.json. - Tolerance: each observable with the lid within 10⁻⁷ of the run without it; the 2 runs without the lid equal the calibration; the hand-over before 5 × 10⁹ years; the counts outside the published tolerances 0 and 34 in the 3 ways; the gross ledger within 10⁻⁴ per call; the lid sub-ledger within 10⁻² per call that starts with the lid. The rows that run again also keep the hand-over time within 10⁻⁴ of the stored run.
- Test id:
tests/test_surface_lid_v5_rows.py::test_row_keeps_its_values_with_the_lidruns E230a and f60_H4 again with and without the lid, and::test_deschamps_vilella_row_with_the_lid_at_the_growth_stop_completesruns f70_15p8_1e7_H3 (nightly).::test_stored_rows_keep_their_values_with_the_lidreads the stored runs and does not run the code, so a change of the code does not fail it. - Command:
pytest tests/test_surface_lid_v5_rows.py -m unit(add--validation-plotsto write the plot pair;-m slowruns the rows again)
A case where the lid hands over
Why this check exists. The lid must hand over to the mesh when the crust is thick enough, and the mesh must then carry the crust. The benchmark rows above also hand over, but they compare only a steady state long after it. This case compares the time after the hand-over, while the flux still changes, with a run that needs no lid.
What it tests. A mantle shell 1000 km thick (radius 5371 to 6371 km) starts at an entropy of 2437.5 J/kg/K, 50 J/kg/K below the lowest solidus entropy on 100 nodes, with a viscosity of the solid of 10¹⁸ Pa s and internal heating of 10⁻¹⁰ W/kg, on the extended PALEOS table, up to 10⁹ years. The solid rheology is on with the 'lid' closure, and the surface radiates as a black body. Three runs use the lid, on 100, 200 and 400 nodes.
They hand over at 1.12, 1.10 and 1.10 × 10⁸ years, with the lid at its growth stop of 8693, 4326 and 2158 m. Between 4 × 10⁸ and 5 × 10⁸ years the surface flux of the 2 reference runs below rises by a factor of 3.7 and 3.6. After that the flux swings about its mean over 2 × 10⁷ years, by up to 8 % on 400 nodes and 3 and 5 % in the 2 references, so the comparison uses those means.
How we know the right answer. Two runs without the lid on 400 nodes, with top cells of 500 and 1000 m, are the reference. They resolve the crust at the hand-over depths of 8 to 33 km. Their surface fluxes differ by 3.8 % at 10⁵ years, 0.75 % at 10⁶ years, 0.12 % at 10⁷ years and less than 10⁻⁴ from 10⁸ to 4 × 10⁸ years, so this page uses them only from 10⁶ years on. Between 4 × 10⁸ and 5 × 10⁸ years the 1000 m run uses 4 shorter parts; their solver restarts differ from the 500 m run. In the mean after 5 × 10⁸ years the 2 runs agree to 2 × 10⁻⁴ in the flux and 1.1 % in the depth of the lid-base isotherm.
The measure of convergence for this case takes the step between meshes, \(s_c = |X_{100}/X_{200} - 1|\) and \(s_f = |X_{200}/X_{400} - 1|\), for \(X\) the surface flux and the depth of the lid-base isotherm, and asks \(r = \max s_f / \max s_c \le 0.75\) after the last hand-over. At the part ends \(r\) is 0.41 for the flux and 0.11 for the depth, so the case passes that measure. The measure uses 100 nodes only as its coarse level. Against the reference the case passes on 200 and 400 nodes only:
| run | flux / reference, mean after 5 × 10⁸ yr | depth / reference, mean after 5 × 10⁸ yr |
|---|---|---|
| 100 nodes with the lid | 0.777 | 1.55 |
| 200 nodes with the lid | 1.008 | 1.09 |
| 400 nodes with the lid | 0.999 | 1.05 |
| reference, 1000 m cell | 1.000 | 1.01 |
The step at the hand-over is a limit of the lid. Between the stored state at the hand-over and the next stored state, 7.8 × 10⁵, 9.7 × 10⁵ and 7.4 × 10⁴ years later, the surface flux rises by 27, 15 and 20 % on 100, 200 and 400 nodes; the states between are not stored, and the windows differ, so the 3 values are not a mesh sequence. Right after the merge the surface node is colder than the equilibrium temperature, and the flux is negative, down to -25 to -39 W/m², for up to about 900 years on 100 nodes and about 200 years on 400 nodes.
The lasting excess fits the lid at its growth stop: there the lid base lies deeper than the node of the top cell, so the column below is warmer than the run without the lid (see Settings and limits), and that heat then leaves through the surface. Before the merge the top node is warmer than that run by 51, 26 and 13 K on 100, 200 and 400 nodes, within 5 % of the length \(\delta - h/2\) times the gradient of the lid. This is a strong match and not a shown cause: no run exists with the lid base moved. The reference has no such step: its largest change over the same time is about 100 times smaller.
The limit set for this case was 5 %, and the lid misses it. The excess falls below 5 % after 29, 8 and 2 million years on 100, 200 and 400 nodes. The energy is kept at the merge (see the checks below); the flux is not continuous. Read the surface flux in the first 10⁷ years after a hand-over with this in mind.
From 10⁶ years, the first stored state, to the last stored state with the lid the flux lies below the 500 m reference, by up to 13 % on 100 and 200 nodes and 4.8 % on 400 nodes; against the 1000 m reference by up to 13, 12 and 4.1 %. On 200 and 400 nodes the largest value is at 10⁶ years. At the last state with the lid the flux lies below by 2, 0.9 and 0.4 %.
Why it matters. A coupled run reads the surface flux at every step. In this case the long-term heat loss of a run with the lid is right on 200 and 400 nodes, and the flux is wrong for a while after the hand-over.
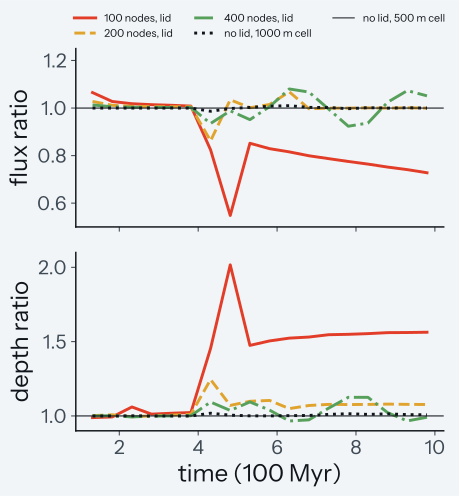
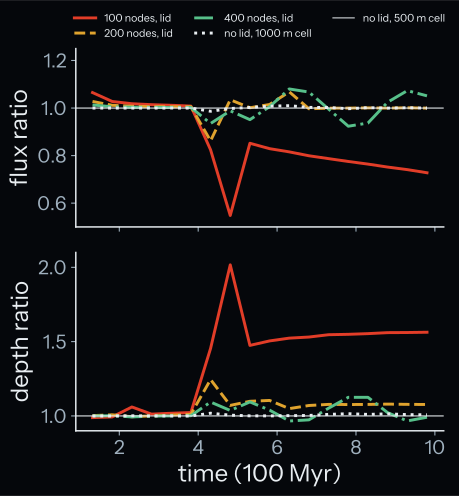
How to read the plot. The horizontal axis is time in units of 100 million years, from just after the last hand-over. Each line is a mean over 2 × 10⁷ years divided by the mean of the 500 m reference, at 18 times. The top panel is the surface flux, the bottom panel the depth of the lid-base isotherm. The lines named by their nodes are the runs with the lid. The dotted line is the 1000 m reference, so its distance from 1 shows how far the reference itself moves. The run on 100 nodes stays low in the flux and deep in the isotherm after that transition; the runs on 200 and 400 nodes swing around 1.
Test details
- Reference: 2 runs without the lid, stored from their series with the runs with the lid in
tests/reference/surface_lid_v8.npzbytests/reference/build_surface_lid_v8.py; each series comes fromtools/verification/run_surface_lid_series.pyon the part files oftools/verification/run_surface_lid_case.py. - Code of the stored runs: the
n100_sha,n200_sha,n400_sha,s500_shaands1000_shafields of the file name the commit of each run. The 3 runs with the lid are repeated with the code of this page only as far as the next 2 bullets say; the 2 runs without the lid are not repeated. - Difference to the code of this page, up to 10⁶ years, on 1 machine: against a commit that gives the stored runs bit for bit on the cluster, the largest relative difference of the state at 10⁶ years is 5.6 × 10⁻¹¹, 1.2 × 10⁻¹² and 4.1 × 10⁻¹¹ on 100, 200 and 400 nodes, and up to 1.6 × 10⁻⁹ at earlier times. On 100 nodes, 5 starts with the start entropy shifted by a relative 1 to 3 × 10⁻¹³ give 4.1 × 10⁻¹² to 5.6 × 10⁻¹¹ at 10⁶ years and up to 9.2 × 10⁻¹⁰ at earlier times. No such set exists on 200 and 400 nodes.
- Difference past 10⁶ years: the run on 100 nodes with the code of this page, from the start to 6 × 10⁸ years through the 2 flux swings after 4 × 10⁸ years, against the stored run on another machine. Up to 5 × 10⁸ years the means over 2 × 10⁷ years differ by at most 2.0 × 10⁻⁷ in the flux and 2.3 × 10⁻⁵ in the depth, and the spread inside those windows by at most 1.1 × 10⁻⁴ and 2.5 × 10⁻⁴.
- Difference in the second swing: the first flux step above 0.01 W/m² starts about 2 × 10⁵ years earlier between the stored states, and the window that holds it differs by 2.8 × 10⁻³ in both means, at most 0.03 of the spread inside the window. After it the means stay 8.9 × 10⁻⁵ and 1.8 × 10⁻⁵ apart, at most 0.07 of that spread. No shifted start exists past 10⁶ years to size this against. The late means run to 10⁹ years, so this covers their first 10⁸ years only. The test does not repeat these runs.
- Tolerance: \(r \le 0.75\) for the flux and the depth (measured 0.41 and 0.11); late mean of the flux within 10⁻² of the reference on 200 and 400 nodes (measured 7.7 × 10⁻³ and 1.3 × 10⁻³), and more than 20 % below it on 100 nodes (measured 22 %); the depth within 10 and 5 % (measured 8.6 and 4.8 %); the 2 references within 10⁻³ in the flux.
- Limit that is missed: flux step at the hand-over 5 % (measured 27, 15 and 20 % over the stored windows above). The test asserts the measured range of the stored runs.
- Merge states:
tests/reference/surface_lid_v8_merge.json, fromtools/verification/run_surface_lid_merge_state.py, asserted in::test_v8_the_merge_states_and_the_offset_of_the_growth_stop. - Run of the code:
tests/test_surface_lid_v8_merge_run.py::test_v8_restart_over_the_merge_gives_the_stored_merge_staterestarts the run on 100 nodes from a stored state 3 × 10⁵ years before the hand-over and passes it, in about 40 s. It asserts the merge time, the lid thickness, the state on both sides of the merge and the time with a negative flux within 10⁻⁶ of the stored run (measured at most 2.6 × 10⁻⁸). This is the test that a change of the merge fails. It needs the extended table (ARAGOG_LOWT_EOS_DIR), which CI does not hold, so it skips there and runs on a machine that has the table. The run from the start to the hand-over and the long time after it are not run again. - Test id:
tests/test_surface_lid_v8.py::test_v8_the_mesh_converges_after_the_hand_over,::test_v8_the_lid_hands_over_at_the_growth_stop_on_all_meshes,::test_v8_the_flux_step_at_the_hand_over_misses_its_limit,::test_v8_the_flux_before_the_hand_over_lies_below_the_reference. These read stored runs and do not run the code again, so a change of the code does not fail them. - Command:
pytest tests/test_surface_lid_v8.py(add--validation-plotsto write the plot pair)
The lid surface under an atmosphere
Why this check exists. In a coupled step with an atmosphere the lid surface loses the heat of a Robin balance, so a balance solved wrongly gives the wrong heat loss of the planet. A lid that drops the slope \(F'\) of the atmosphere flux ends 218.6 K too warm at \(F'\) = 1000 W m\(^{-2}\) K\(^{-1}\), and the test sees it.
What it tests. In a coupled run the atmosphere holds the lid surface at \(T_\mathrm{held}\) and gives the lid a flux cap \(C\). Where the held lid would conduct more than \(C\), the surface warms to \(T_s\) and loses \(C + F' (T_s - T_\mathrm{held})\), with \(F'\) the slope of the atmosphere flux with the surface temperature. Here a lid of \(\delta\) = 100 m with \(k\) = 3 W m\(^{-1}\) K\(^{-1}\), \(T_b\) = 1400 K, and constant \(\rho\) = 3000 kg/m³ and \(c_p\) = 1200 J/kg/K holds the energy of a straight profile at a 600 K surface. The held surface is 500 K and the cap 14 W m\(^{-2}\). The test solves for the surface temperature \(T_s\) and the shape \(s\) of the profile at 10 slopes \(F'\) from 0 to 1000 W m\(^{-2}\) K\(^{-1}\), with robin_surface_state (NumPy) and the capped surface state of the JAX right-hand side.
How we know the right answer. The surface of the lid holds no heat, so the heat conducted to it equals the heat the atmosphere takes: \(k (T_b - T_s) f_s'(0) / \delta = C + F' (T_s - T_\mathrm{held})\). The profile must also hold the lid energy: for constant \(c_p\), \(E_\mathrm{lid} / \delta = -\rho c_p (T_b - T_s)(1 - m(s))\), with \(m(s)\) the mean of the profile \(f_s\). Both \(f_s'(0)\) and \(m(s)\) have closed forms from the error function for \(s > 0\) and the imaginary error function for \(s < 0\). The test solves the two equations for \(s\) and \(T_s\) with a root finder of its own, without the lid functions. At \(F'\) = 0.1 the root is the straight profile at 600 K, since 3 × 800 / 100 = 14 + 0.1 × 100 W m\(^{-2}\).
Why it matters. This balance sets the heat the planet loses through a lid in a coupled step with an atmosphere, and so the cooling of the magma ocean once a crust forms.
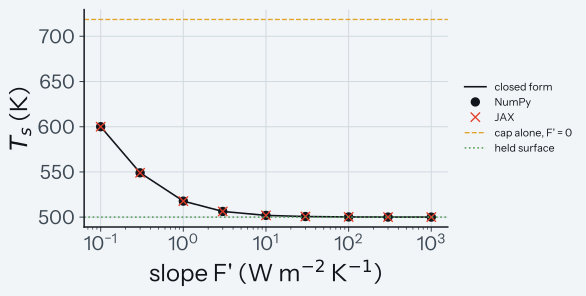
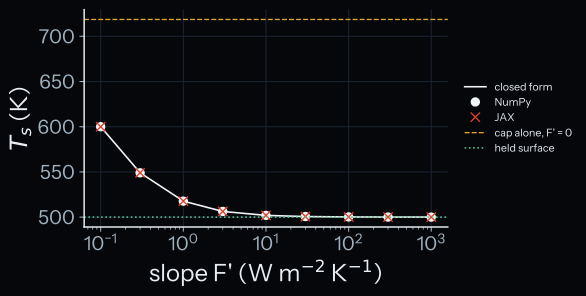
How to read the plot. The horizontal axis is the slope \(F'\) on a log scale, the vertical axis the surface temperature \(T_s\) in K. The line joins the closed-form roots at the 9 slopes, the dots are NumPy and the crosses JAX; they lie on the roots. The dashed line is the cap alone (\(F'\) = 0, 718.6 K), and the dotted line the held surface (500 K). A larger slope pulls the surface toward the held one.
Test details
- Reference: analytical limit, the surface balance and the energy of the similarity profile (Turcotte and Schubert (2014)3 section 4.18 for the profile family).
- Tolerance: relative 10⁻⁹ on \(T_s\) and on the surface flux; relative 10⁻⁷ and absolute 10⁻⁹ on \(s\) (near 0 at \(F'\) = 0.1); NumPy and JAX.
- Discrimination: the cap alone is 218.6 K warmer than the root at \(F'\) = 1000 W m\(^{-2}\) K\(^{-1}\), which lies 0.02 K above the held surface.
- Test id:
tests/test_surface_lid_atmosphere.py::test_the_robin_surface_solves_the_energy_and_the_surface_balance - Command:
pytest tests/test_surface_lid_atmosphere.py(add--validation-plotsto write the plot pair)
The weight of the lid at its onset
Why this check exists. Under a held surface the lid switches on through its weight \(w\), from 0 (no lid) to 1 (a full lid). A weight with a step, 1 wherever a steady crust would be thicker than the onset thickness, jumps from 0 to 1 at one surface temperature: the heat loss of the planet then jumps too, and the coupled steps can flip between the two states. The test checks that the weight rises without a step.
What it tests. For a held surface \(T_s\) the steady crust that carries the base flux \(F_b\) has the thickness \(\delta_\mathrm{eq} = k (T_b - T_s) / F_b\). The weight is \(w = \frac{1}{2}\left(1 + \tanh\left(\log_{10}(\delta_\mathrm{eq} / \delta_\mathrm{on}) / W\right)\right)\), with \(\delta_\mathrm{on}\) the onset thickness and \(W\) = LID_EXIST_WIDTH = 0.1, set to 0 below 10⁻¹⁰. The test compares flux_weight of NumPy and JAX with this form for \(\delta_\mathrm{eq} / \delta_\mathrm{on}\) from 10⁻³ to 10², at \(F_b\) = 10, 100 and 1000 W m\(^{-2}\), with \(T_b\) = 1400 K, \(k\) = 4 W m\(^{-1}\) K\(^{-1}\) and \(\delta_\mathrm{on}\) = 0.02 m, so that the surface stays at or above 900 K. On both it also checks \(w\) = 0.5 where \(T_b - T_s = F_b \delta_\mathrm{on} / k\), \(w\) = 0 for a surface at or above \(T_b\) (also for \(F_b \le 0\)), and \(w\) = 1 for \(F_b \le 0\) below \(T_b\); on NumPy, \(w\) = 0 in the last 0.06 \(F_b \delta_\mathrm{on} / k\) below \(T_b\).
How we know the right answer. A steady crust conducts the base flux, which gives \(\delta_\mathrm{eq}\); the weight form is a smooth step in \(\log_{10} \delta_\mathrm{eq}\), centred at \(\delta_\mathrm{on}\). The NumPy and JAX functions are two implementations of it, and the test checks both against the formula.
Why it matters. The onset weight decides when the crust starts to insulate the magma ocean in a coupled run. A smooth weight lets the heat loss change over several coupled steps instead of in one.
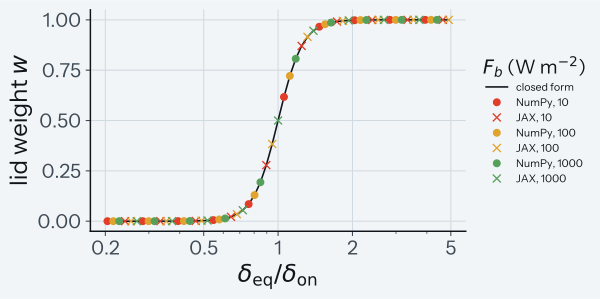
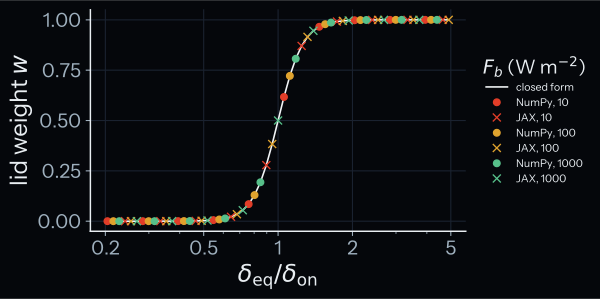
How to read the plot. The horizontal axis is \(\delta_\mathrm{eq} / \delta_\mathrm{on}\) on a log scale, the vertical axis the weight \(w\). The plot shows the window from 0.2 to 5, where the weight rises; the test asserts the full range. The line is the closed form; the dots are NumPy and the crosses JAX, one colour for each base flux. All three fluxes fall on one curve, which passes 0.5 at 1. In kelvin the half weight lies 0.05, 0.5 and 5 K below \(T_b\) for the three fluxes.
Known limit. The test takes the width \(W\) from the code, so a change of LID_EXIST_WIDTH moves both sides of the comparison and is not caught; the floor 10⁻¹⁰ is typed in the test, so a change of it is caught. The form of the weight is a modelling choice; this case checks that the code computes it, not that it is the right physics.
Test details
- Reference: analytical form of the weight from the steady crust thickness.
- Tolerance: relative 10⁻¹² and absolute 10⁻¹⁵ at each point, NumPy and JAX, against the closed form at the surface temperature the code receives; the half weight to absolute 10⁻¹⁰, the rounding of \(T_b - T_s\) at 1400 K.
- Discrimination: a step weight jumps from 0 to 1 at \(\delta_\mathrm{eq} = \delta_\mathrm{on}\); the code gives 0.5 there.
- Test id:
tests/test_surface_lid_atmosphere.py::test_the_onset_weight_rises_without_a_step_below_the_base - Command:
pytest tests/test_surface_lid_atmosphere.py(add--validation-plotsto write the plot pair)
Where the lid is not validated
Why this section exists. The cases above compare the lid with a fine mesh for a solid shell with a fixed lid base and for a shell freezing from the mush without the solid rheology. For a molten shell without the solid rheology they compare only the hand-over and the coarse mesh after it. These configurations have no comparison with a fine mesh:
- a molten shell with the solid rheology on, described below;
- the
'lid'closure in any start: the section above measures only its sensitivity; - a mush start with the solid rheology on;
- a solid shell whose lid base is not a fixed temperature at the start temperature;
- the lid on the tables under a fixed surface temperature: a test shows only that it runs, keeps its surface at the boundary temperature and closes its energy ledger.
What we know about the molten shell with the solid rheology. The lid base lies at the rheological temperature, at or below the solidus. Without lid_mush_base, the lid never hands over with the 'local' closure, and with the 'lid' closure it does not hand over in this case either. A run of the same shell on 4000 nodes (cells of 6.25 m) without the lid used all of its 8 GB of memory before its first output at 100 years. The run on 4000 nodes without the solid rheology stopped the same way. So this case has no resolved reference. This page makes no claim on the error of the lid in it.
Why it matters. Until a mesh resolves that crust, the error of the lid for a molten start with the solid rheology is not known. Use the lid there only with this limit in mind.
The pressure of the lid base. The lid takes its base temperature, heat content and density at the pressure of the top-cell centre. The cases above use thin top cells, so they do not test a coarse mesh, where the solidus at the top-cell centre lies above the solidus at the lid base (see Settings and limits).
No buoyancy. The lid has no buoyancy test: it stays at the surface until the hand-over, whatever the density contrast with the fluid below (see Settings and limits).
Two more limits. The lid runs only with the grey-body surface (outer_boundary_condition = 1) or a fixed surface temperature (outer_boundary_condition = 5); another outer boundary stops at setup with an error. It needs one of 2 setups: the entropy EOS tables, or constant properties with entropy_eos=None, the solid rheology, the 'lid' closure and core_bc = 'quasi_steady'. Any other setup stops with an error, and so do core_bc = 'gradient' and 'bower2018' with either setup.
The lid on the stagnant-lid benchmarks checks these 2 settings only after the hand-over, so the crust before the hand-over has no comparison with a fine mesh there. The hand-over of the lid to the mesh is checked inside the solver (energy-exact merge, a run after the hand-over equals the run without the lid). A case where the lid hands over measures its convergence after the hand-over in one case.
Checks of the lid inside the solver
These tests run the lid inside the full solver; they check exact properties of the code and have no plot.
- The energy of the mantle and the lid together changes only by the heat that crosses the surface and the core boundary, on random lid thicknesses up to the growth stop and random entropy profiles:
tests/test_subgrid_lid_solver.py::test_ledger_per_call_closes. - Over a solve, the solver residual of the energy budget closes to 10⁻¹⁰ of the surface power, and the heat of the state matches the budget to 10⁻², the accuracy of its quadrature:
tests/test_subgrid_lid_solver.py::test_ledger_over_a_solve. - With the lid off, the solver gives the results stored in
tests/reference/subgrid_lid_v0_reference.npz, a run of the code without the lid; itsbase_commitkey names the commit. The mesh and a right-hand side match to 10⁻¹⁰ and a 2-yr solve to 10⁻⁹, with and without the rheology, on the NumPy and JAX paths:tests/test_subgrid_lid_off_path.py. - With the lid off, a 5-yr NumPy solve with tidal and radiogenic heating on each of
quasi_steady,energy_balanceandcore_modulematches its end state and its energy integrals to 10⁻⁸; the solver residual and the core energy, differences of large terms, match to 10⁻¹⁵ and 10⁻¹² of the surface energy (measured between macOS and Linux: 8.2 × 10⁻¹⁷ and 2.2 × 10⁻¹⁴):tests/test_subgrid_lid_off_path.py. - The Stefan jump is the integral of \(\rho T\) over entropy from the lid base to the melt at the top-cell pressure, on the NumPy and JAX right-hand sides, and zero for a melt at the base entropy:
tests/test_subgrid_lid_jump.py. - Sanity check: with no heat from the melt, a lid over a molten column grows as the Stefan law taken step by step along the run, with the Stefan number and diffusivity of each state, to 1 % at 10, 20 and 40 nodes (measured within 0.45 %):
tests/test_subgrid_lid_solver.py::test_lid_growth_sanity_against_quasi_static_neumann. The grey surface cools during the run, so a law with one surface temperature does not apply. The check takes its heat capacity from the run, so it does not tell one heat content from another; the fine-mesh cases above do. - The hand-over of the lid to the mesh keeps the energy, and a run resumed after it evolves as a run without the lid:
tests/test_subgrid_lid_solver.py::test_merge_is_energy_exact,::test_resume_after_handover_matches_the_lid_off_run. - Without the solid rheology the lid hands over where the top cell cools through its solidus, on every integrator path, and before the call when the top cell starts at or below it:
tests/test_subgrid_lid_solver.py::test_lid_hands_over_where_the_top_cell_freezes,::test_top_cell_at_or_below_the_solidus_hands_over_at_the_start.
Known limit. With the solid rheology and without lid_mush_base, the lid hands over only with stress_closure_mode = 'lid', whose lid-base isotherm sets the hand-over depth; with another closure the lid never hands over (tests/test_subgrid_lid_solver.py::test_no_handover_without_the_lid_closure, ::test_no_solidus_handover_with_the_rheology). Outside the solid regime (no active stagnant lid, or a top cell past the rheological transition) it does not hand over either (::test_no_handover_outside_the_solid_regime), and a hand-over whose isotherm has passed the face fires where the solid regime begins (::test_handover_fires_where_the_solid_regime_begins).
-
F. Deschamps, K. Vilella, Scaling laws for mixed-heated stagnant-lid convection and application to Europa, Journal of Geophysical Research: Planets, 126, e2021JE006963, 2021. SciX. ↩
-
J. Korenaga, Scaling of stagnant-lid convection with Arrhenius rheology and the effects of mantle melting, Geophysical Journal International, 179, 154–170, 2009. SciX. ↩
-
D. L. Turcotte, G. Schubert, Geodynamics, 3rd edition, Cambridge University Press, 2014. SciX. ↩↩↩↩↩