Core alloy liquidus
What this page checks
This page checks the liquidus of the core alloy, aragog.core.AlloyLiquidus: the temperature at which iron with S, C, O, Si, H and N starts to freeze (explanation), with concentrations in wt%, percent by mass. Validation here means that a test runs the code on a case with a known right answer and checks that the code gives it, within a stated tolerance. The answer is a curve that a paper draws, a temperature it states, a second read of a figure or a rule written out by hand in the test. The slope case is the exception: it pins the code's own output, so it catches a later change but is not an independent answer. A wrong liquidus puts the inner-core boundary of a planet at the wrong radius, and a wrong slope of the liquidus puts the first freezing at the wrong depth. Each case says why the check exists, what it tests, how we know the right answer and why it matters, then shows its plot and ends with a box "Test details".
Test files:
tests/test_core_alloy_liquidus.pytests/test_core_alloy_liquidus_low_pressure.py, for the pressures below 26 GPa
The end points of each binary
Why this check exists. An error in the constant \(A\) or in the mole fractions moves a binary off its 2 end points, pure iron and the eutectic.
What it tests. Each Fe-X binary (S, C, O), iron with one light element X, is fixed by 2 points: pure iron and the eutectic. The eutectic is the lowest point of the Fe-rich liquidus, at composition \(w_e\) and temperature \(T_e\). The tests check that each binary meets both points and how Si, H and N enter an alloy.
Details
- At zero light element the liquidus must be the pure-iron melting curve exactly.
- At the eutectic composition \(w_e\) it must be the eutectic temperature \(T_e\) to a relative \(10^{-12}\).
- The test runs at 10, 60, 135, 254, 330 and 450 GPa, also where the eutectic point is extrapolated.
- A second test checks that Si, H and N alone leave the liquidus at pure iron.
- It also checks that H and N leave an alloy as if they were removed.
- It also checks that Si dilutes the S units by the mole fractions written out by hand.
How we know the right answer. The construction of the ideal form (analytical). The ideal form is the ideal-solution law of the liquidus, with one constant \(A\) per binary and pressure. \(A\) is chosen so that the curve passes through the eutectic point.
Why it matters. Every alloy liquidus is built from these binaries, so the error would reach every core alloy.
This case has no plot: it checks an identity of the code, the 2 points that each binary is built to meet, with nothing to draw.
Test details
- Reference: the ideal form through pure iron and the eutectic point (analytical).
- Tolerance: exact at zero light element; relative \(10^{-12}\) at the eutectic.
- Test id:
::test_each_binary_runs_through_pure_iron_and_its_eutectic,::test_si_h_and_n_lower_no_melting_point,::test_h_and_n_leave_the_mole_basis,::test_si_counts_with_the_iron_solvent(unit tier) - Command:
pytest -o "addopts=" tests/test_core_alloy_liquidus.py -k "binary_runs or lower_no_melting or mole_basis or solvent"
The Fe-S liquidus curves of Mori et al. (2017)
Why this check exists. Counting S against the wrong compound units gives a wrong curve between pure iron and the eutectic, with correct end points.
What it tests. The binary form runs through the end points of each curve that Mori et al. (201714, Fig. 9) draw for the Fe-rich side of the Fe-Fe\(_3\)S system, at 30, 130 and 250 GPa. Counting Fe against Fe\(_3\)S units, the ideal form must match the curves. On S atoms the same form gives other curves, which must miss. A second test runs the shipped AlloyLiquidus with its own eutectic data against the same curves.
How we know the right answer. The 3 curves of Mori et al. (201714, Fig. 9), read twice (see the last case). Mori et al. (201714, p. 138) draw them from their own ideal-solution model through their eutectic points. So this case checks that Aragog reproduces their model curves, not measured liquidus points. Their measurements enter through the eutectic points.
Root-mean-square (RMS) difference at 30, 130 and 250 GPa, the square root of the mean squared difference at the curve points:
| Case | Value | Reference | Difference (RMS) |
|---|---|---|---|
| Fe\(_3\)S units | binary form | first read | 2.06, 2.22 and 0.70 K |
| Fe\(_3\)S units | binary form | second read | 3.61, 3.27 and 1.37 K |
| S atoms | binary form | drawn curves | 304, 193 and 136 K |
| Shipped liquidus | AlloyLiquidus |
first read | 2.6, 2.0 and 4.6 K |
At 30 GPa the curve bends down towards the eutectic. The Fe\(_3\)S units give this bend. S atoms do not.
Why it matters. The S content of a core sets most of its melting point depression, the drop of the melting point below that of pure iron.
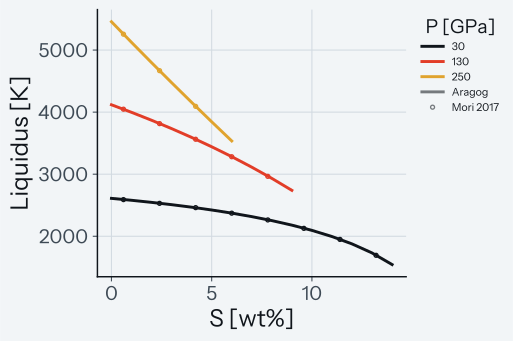
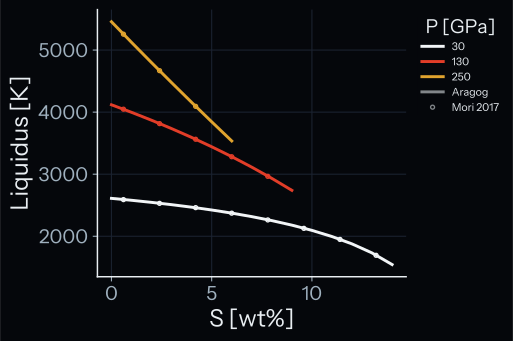
How to read the plot. The x-axis is the S content in wt% and the y-axis the liquidus in K. The lines are the binary form on Fe\(_3\)S units through the end points of each curve. The circles are the second read of the curves of Mori et al. (201714). A pass means that the circles lie on the lines at all 3 pressures.
Test details
- Reference: Mori et al. (201714), Fig. 9, 2 reads (
tests/validation/data/core_eutectics/mori_liquidus_*GPa.csv). - Tolerance: RMS below 5 K (first read) and 6 K (second read); above 100 K on S atoms; the shipped liquidus below the stated RMS plus 1 K.
- Test id:
::test_the_fe_s_liquidus_curves_of_mori_are_the_ideal_form_on_fe3s_units,::test_the_shipped_liquidus_misses_the_figure_curves_as_stated(unit tier) - Command:
pytest -o "addopts=" tests/test_core_alloy_liquidus.py -k "mori or shipped_liquidus"
The Fe-C liquidus curves of Mashino et al. (2019)
Why this check exists. The C units (Fe\(_3\)C below 255 GPa, Fe\(_7\)C\(_3\) above) are not verified, so the Fe-C liquidus between pure iron and the eutectic can move further from the measured curves.
What it tests. The binary form runs through the end points of each curve of Mashino et al. (201911, Fig. 8) at 54, 138, 203, 255 and 330 GPa. The test states how far the ideal form is from the drawn curves and keeps the misfit from growing. A second test runs the shipped AlloyLiquidus with its own eutectic data against the same curves.
How we know the right answer. The 5 curves of Mashino et al. (201911, Fig. 8), read twice (see the last case). The zero-C end of each curve is taken at \(w = 0\), by extrapolation of the first 2 points of the curve.
Difference to the drawn curves at 54, 138, 203, 255 and 330 GPa:
| Case | Value | Reference | Difference |
|---|---|---|---|
| Ideal form | binary form | drawn curves | RMS 48.7, 110.1, 120.8, 114.5 and 101.5 K |
| Ideal form | binary form | drawn curves | lies above by at most 69, 154, 173, 159 and 142 K |
| Straight lines between the end points | straight lines | drawn curves | RMS 0.0, 38.9, 42.6, 84.8 and 112.4 K |
| Shipped liquidus | AlloyLiquidus |
drawn curves | RMS 46.5, 175.1, 103.5, 105.1 and 70.1 K |
The shipped eutectic points come from the Simon fit and the composition curve of the same paper. The Simon fit is a fit of the eutectic temperature against pressure. These points differ from the ends of the drawn curves: at 138 GPa the fit gives 3012 K, while the curve ends at 2885 K.
Why it matters. A core with C melts on this liquidus, so its misfit moves the inner-core boundary of a C-bearing core. It is the least certain part of the model.
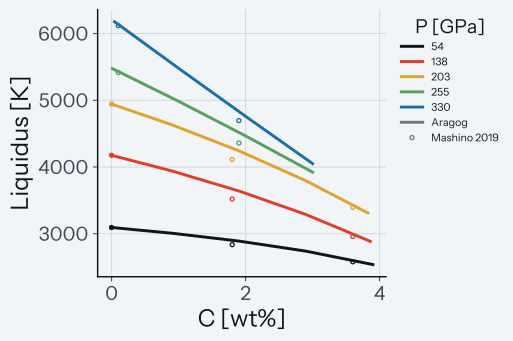
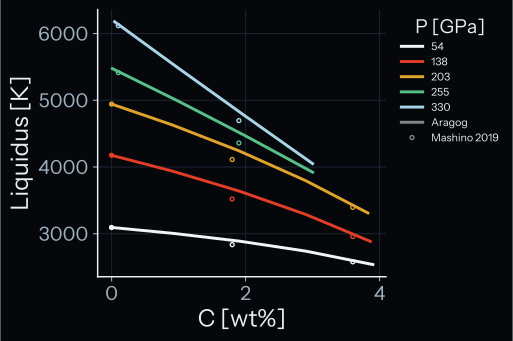
How to read the plot. The x-axis is the C content in wt% and the y-axis the liquidus in K. The lines are the binary form through the end points of each curve. The circles are points of the first read of the curves of Mashino et al. (201911). Between the end points the circles lie below the lines. The drawn curves are close to straight lines, and the ideal form lies above them.
Known limit. Between pure iron and the eutectic, the liquidus of a C-bearing alloy differs from the drawn curves by an RMS of 47 to 175 K.
Test details
- Reference: Mashino et al. (201911), Fig. 8, 2 reads (
tests/validation/data/core_eutectics/mashino_liquidus_*GPa.csv). - Tolerance: RMS below the stated value plus 1 K (form and shipped liquidus).
- Test id:
::test_the_fe_c_misfit_against_mashino_stays_as_stated,::test_the_shipped_liquidus_misses_the_figure_curves_as_stated(unit tier) - Command:
pytest -o "addopts=" tests/test_core_alloy_liquidus.py -k "mashino or shipped_liquidus"
Eutectic temperatures
Why this check exists. A wrong fit constant or a wrong table shifts the eutectic temperature.
What it tests. The Fe-S eutectic temperature at 254 GPa and the Fe-C eutectic temperature at 330 GPa must meet the values the papers state. The Fe-C value must also meet the Simon fit of Mashino et al. (201911), retyped in the test. The Fe-O eutectic temperature from 0 to 325 GPa, the end of the Fe-O data, must lie on the curve of Oka et al. (201915, Fig. 4).
How we know the right answer. Mori et al. (201714) measured 3550 K at 254 GPa (run 11). Mashino et al. (201911, p. 140) give about 3750 K at 330 GPa. Oka et al. (201915) draw the Fe-O curve. The test uses its second read, the read that the table does not come from.
| Case | Value | Reference | Difference |
|---|---|---|---|
| Fe-S, 254 GPa | 3541.1 K | 3550 K (Mori et al. 201714, run 11) | \(-8.9\) K |
| Fe-C, 330 GPa | 3713.3 K | about 3750 K (Mashino et al. 201911, p. 140) | \(-36.7\) K |
| Fe-O, 0 to 325 GPa | Aragog table | second read of Oka et al. (201915, Fig. 4) | within 0.354 pt |
Up to the end of each range the eutectic equals the shipped tables. At 330 GPa it equals the anchors, the fixed end points of the data: 5 wt% S, 3.35 wt% C and the Fe-C fit.
Why it matters. Near the eutectic the liquidus of an alloy follows the eutectic temperature, so the error shifts the whole liquidus there.
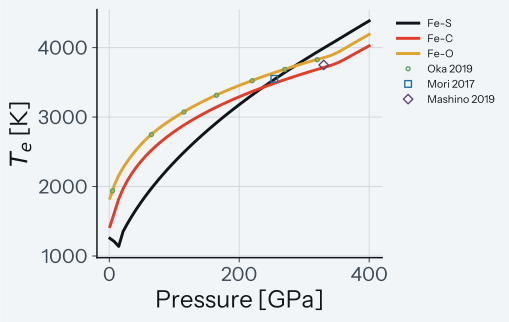
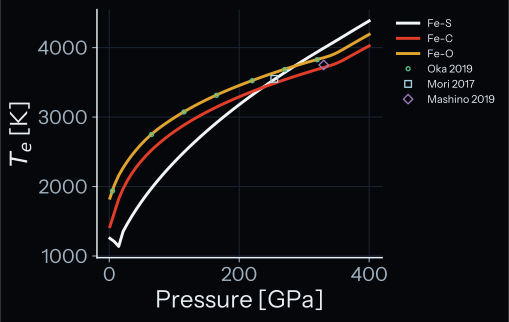
How to read the plot. The plot shows the eutectic temperature \(T_e\) in K against the pressure in GPa, with one Aragog line per binary. The circles are points of the second read of Oka et al. (201915) and must lie on the Fe-O line. The square (Mori et al. 201714) and the diamond (Mashino et al. 201911) must lie at most 50 K from their lines.
Test details
- Reference: Mori et al. (201714), run 11; Mashino et al. (201911), p. 140; Oka et al. (201915), Fig. 4, read B.
- Tolerance: 50 K (Fe-S, Fe-C); relative \(10^{-3}\) against the Fe-C fit; 0.354 pt perpendicular distance in figure points (Fe-O).
- Test id:
::test_the_eutectic_temperatures_meet_the_papers,::test_the_fe_o_eutectic_temperature_meets_the_second_read(unit tier) - Command:
pytest -o "addopts=" tests/test_core_alloy_liquidus.py -k "eutectic_temperature"
Several light elements
Why this check exists. A mean of the wrong kind for the constants \(A_i\) of the binaries gives a depression that is too small by up to half at 330 GPa.
What it tests. For an alloy with 2 wt% S, 0.5 wt% C and 3 wt% O at 135 and 330 GPa, the depression \(T_\mathrm{Fe} - T\) must equal the harmonic rule computed by hand and the stated values. It must lie between the composition-weighted rule and the sum of the binary depressions. Scaled down by 10, 100 and 1000, the depression over the dilute sum \(T_\mathrm{Fe} \sum_i x_i / A_i\) must tend to 1.
How we know the right answer. The rules written out in the test and the dilute limit of the ideal form (analytical). The harmonic rule, used by Aragog, combines the \(A_i\) as a harmonic mean weighted by mole fraction. The dilute limit is the limit of a very small light-element content.
Depression of the alloy under each rule:
| Case | 135 GPa | 330 GPa |
|---|---|---|
| Harmonic rule (Aragog) | 640.7 K | 1748.6 K |
| Composition-weighted rule | 488.7 K | 886.6 K |
| Sum of the binaries | 664.2 K | 1983.4 K |
| Dilute sum | 679.6 K | 2207.9 K |
| Case | Value | Reference |
|---|---|---|
| Depression over the dilute sum, content scaled down by 10 | 0.99462 | 1 |
| Depression over the dilute sum, content scaled down by 100 | 0.99947 | 1 |
| Depression over the dilute sum, content scaled down by 1000 | 0.99995 | 1 |
Why it matters. A core holds several light elements at once. With the composition-weighted rule, the depression of the alloy above at 330 GPa would be about half as large, and the inner-core boundary would move with it.
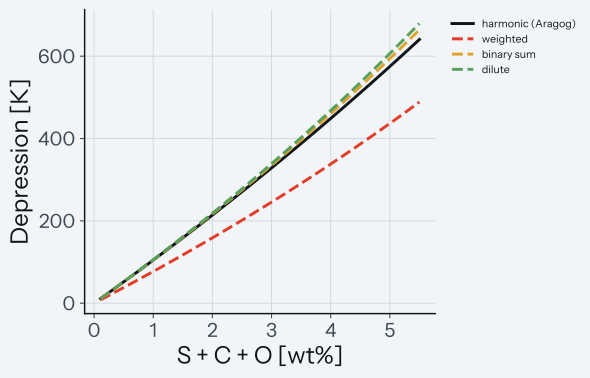
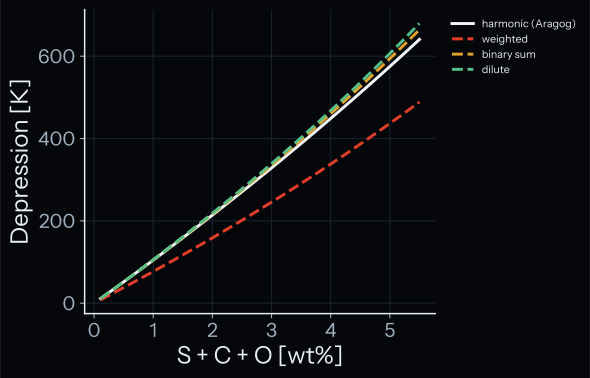
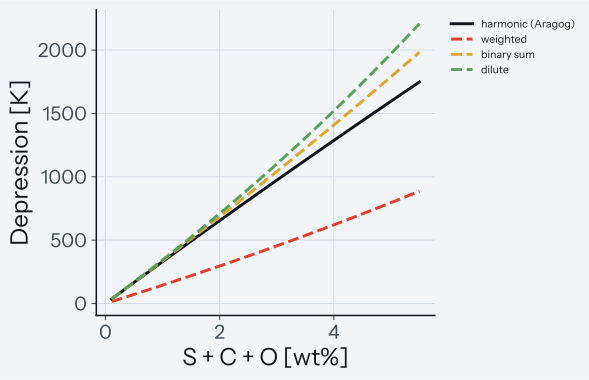
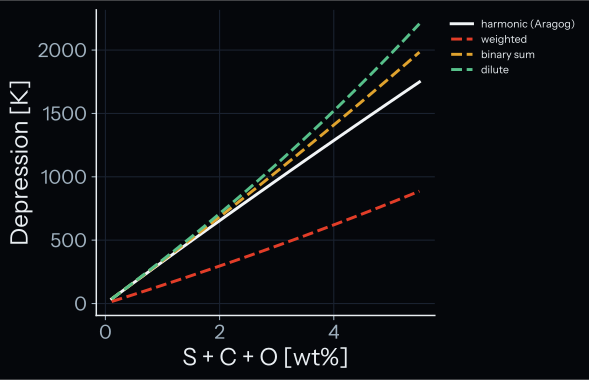
How to read the plot. The plots show the depression in K at 135 GPa (top) and 330 GPa (bottom). The x-axis is the total S + C + O content in wt%, at a fixed ratio of 4 : 1 : 6 by mass. The solid line is the harmonic rule of Aragog, the dashed lines 3 other rules. All rules agree at small content. The harmonic rule stays close to the sum of the binaries and far from the composition-weighted rule.
Test details
- Reference: the 4 rules and the dilute limit, written out in the test (analytical).
- Tolerance: relative \(10^{-12}\) against the harmonic rule; 0.1 K against the stated values; ratio at most \(10^{-3}\) from 1 at the smallest content.
- Test id:
::test_the_harmonic_rule_gives_the_stated_depressions,::test_the_harmonic_rule_meets_the_dilute_limit(unit tier) - Command:
pytest -o "addopts=" tests/test_core_alloy_liquidus.py -k harmonic
The slope of the liquidus
Why this check exists. A table kink, an anchor or the end of the data can give the liquidus a false slope \(dT/dP\).
What it tests. Where the liquidus slope is smaller than the slope of the core adiabat, iron freezes first at the top. The adiabat is the temperature profile of the core at constant entropy. The tests check the sign and smoothness of the slope near table kinks, anchor points and the end of the data, which can make a false slope.
Details
- For C contents of 0.5 to 3.2 wt%, S up to 4.8 wt%, O up to 10 wt% and 2 mixed alloys, the slope must be positive at every pressure up to 600 GPa where the alloy is not past its eutectic.
- This holds from 26 GPa for alloys with S and from 1 GPa for the others. Below 26 GPa the case "The low-pressure eutectic" pins the slope of S alloys.
- Over 325 to 380 GPa, into the extrapolation above the data, the slope must change by less than 0.1 K/GPa between points 0.1 GPa apart.
- Some alloys have a sum of \(w_i / w_{e,i}\) that passes 1 above the data. They must cross their eutectic once, at the pinned pressure and with the pinned slope step. S and C alloys and an S-C mixture cross into it, O alloys out of it.
- Across the blend of the 2 C units, the slope must fall less than 1 K/GPa below the lower of its values at 229 and 281 GPa, just outside the blend.
- For 4.9 to 7 wt% S and for 4 wt% S with 1 wt% C, the least slope and the pressures where the slope is negative are pinned. Outside them the slope must be positive.
How we know the right answer. A liquidus of a fixed composition rises with pressure where its data do. The pinned values are the code's own output on the read curve of Mori et al. (201714, Fig. 5). They catch a later change of the code. They are not an independent answer.
| Case | Value | Required |
|---|---|---|
| Least slope, 3.2 wt% C | +0.12 K/GPa | above 0 |
| Largest change between points 0.1 GPa apart, 325 to 380 GPa (3 wt% C) | 0.025 K/GPa | below 0.1 K/GPa |
| Fall across the C blend below the lower of the values at 229 and 281 GPa (2 wt% C) | 0.76 K/GPa | below 1 K/GPa |
| The same fall for a 10 GPa blend, for comparison | 3.7 to 8.9 K/GPa | not used |
Why it matters. The slope decides where a core starts to freeze: a false negative slope gives a top-down crystallisation regime in a coupled run.
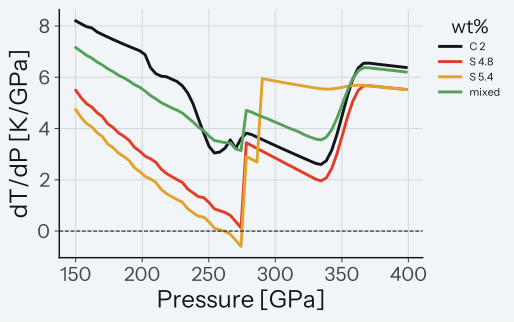
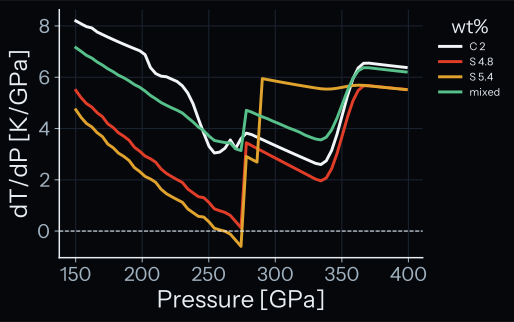
How to read the plot. The plot shows the slope \(dT/dP\) in K/GPa against the pressure in GPa for 4 alloys. They are 2 wt% C, 4.8 and 5.4 wt% S, and the tutorial alloy (S 2, C 0.5, O 3, Si 4 wt%). A pass means that every line except 5.4 wt% S stays above the dashed line at 0. The 5.4 wt% S line dips below 0 at 259 to 275 GPa.
Details
The small kinks are the 5 GPa nodes of the composition tables. The larger kinks at 275 GPa (S) and 270 GPa (C) are the nodes where the read curves join the straight segments to the 330 GPa anchors. Above the data the slopes join the homologous rule without a step. The homologous rule keeps the ratio of the eutectic temperature to the melting curve of pure iron.
Known limit. Close to its eutectic the liquidus falls with pressure where the eutectic composition falls fast. Above the data, some alloys cross their eutectic by extrapolation of the composition tables. The ranges are in the note below.
Details
Pressures where the liquidus falls with pressure:
| Alloy | Negative slope from | Least slope |
|---|---|---|
| 4.9 wt% S | 274.4 to 274.9 GPa | \(-0.036\) K/GPa |
| 5.0 wt% S | 272 to 275 GPa | \(-0.16\) K/GPa |
| 5.4 wt% S | 259 to 275 GPa | \(-0.64\) K/GPa |
| 5.8 wt% S | 244 to 261 GPa | \(-0.51\) K/GPa |
| 6 wt% S | 238.5 to 252.1 GPa | \(-0.44\) K/GPa |
| 7 wt% S | 208.9 to 209.9 GPa | \(-0.072\) K/GPa |
| 4 wt% S with 1 wt% C | 270 to 273 GPa | \(-0.37\) K/GPa |
| 3.28 to 3.37 wt% C | between 323.8 and 336 GPa | down to \(-0.105\) K/GPa for 3.34 wt% |
Alloys that cross their eutectic above the data:
| Alloy | Direction | Pressure |
|---|---|---|
| 4.85 wt% S | into it | 348 GPa |
| 4.9 wt% S | into it | 341 GPa |
| 4.95 wt% S | into it | 335 GPa |
| 5 wt% S, the end value | into it | 330.01 GPa, just above the data |
| 3.3 wt% C | into it | 344 GPa |
| 3.35 wt% C, the end value | into it | 330.01 GPa, just above the data |
| 4 wt% S with 0.65 wt% C | into it | 333 GPa |
| 15.2 wt% O | out of it | 338 GPa |
| 15.28 wt% O | out of it | 354 GPa |
Test details
- Reference: the sign of the slope (physical); for 4.9 to 7 wt% S, pinned values of the code's own output on the read curve of Mori et al. (201714, Fig. 5). The tests carry the marker
physics_invariant, notreference_pinned. - Tolerance: slope above 0; step below 0.1 K/GPa; crossing pressures to 0.02 GPa; blend dip below 1 K/GPa; pinned least slope to 0.01 K/GPa and the negative range within 0.2 GPa.
- Test id:
::test_the_liquidus_rises_with_pressure,::test_the_end_of_the_data_adds_no_slope_step,::test_alloys_near_the_end_eutectic_cross_it_above_the_data,::test_the_fe_c_liquidus_falls_near_the_end_of_its_data_for_3_28_to_3_37_wt_percent,::test_the_carbon_unit_switch_adds_no_slope_dip,::test_near_the_eutectic_the_liquidus_falls_where_the_read_curve_falls,::test_the_liquidus_slope_against_pressure(unit tier) - Command:
pytest -o "addopts=" tests/test_core_alloy_liquidus.py -k "slope or rises or falls or cross"; the plot:pytest -o "addopts=" tests/test_core_alloy_liquidus.py -k slope_against_pressure --validation-plots
The Fe-S liquidus from 1 bar to 15 GPa
Why this check exists. The ideal form does not follow the curved liquidus that experiments measure at these pressures, and a change of the form could make the misfit grow unseen.
What it tests. Below 21 GPa the liquidus uses the ideal form on FeS units through measured eutectic points. The measured liquidus at these pressures is not ideal: it has a negative curvature and, at 14 GPa, 2 inflection points (Buono & Walker 20111; Chen et al. 20082). The tests state how far the shipped AlloyLiquidus is from measured liquidus points and keep the misfit from growing.
Details
- The points: 19 at 1 bar (Friedrich 19107 and Miyazaki 192812, as compiled by Hansen & Anderko 19588 and drawn by Buono & Walker 20111, Fig. 6), 21 at 6 GPa (Buono & Walker 20111, Table 1) and 7 and 4 at 10 and 14 GPa (Chen et al. 20082, Fig. 1, read A).
- At every pressure the test takes the points with S on the Fe-rich side of the shipped eutectic. This leaves out the 2 pure-iron points and the 2 points past the eutectic at 1 bar. At 6 GPa it leaves out the eutectic run and 2 points past the eutectic.
- The RMS and the mean misfit must equal the stated values to 0.05 K.
- A second test pins the change of the liquidus from 10 to 14 GPa at 4, 8 and 12 wt% S against the same points. It also pins the S content from which code and data fall from 10 to 14 GPa (to 0.005 wt%).
How we know the right answer. Measured liquidus temperatures. None of these points sets a node of the eutectic.
Details
- 1 bar: the points are read twice, from the vector marker centres and from a 600 dpi raster. The second read finds the markers without the first. The 2 reads agree to 0.27 pt of the figure, 1.2 K and 0.0003 in mole fraction, against a bound of 0.5 pt.
- 6 GPa: run temperatures with \(\pm 25\) K and microprobe compositions of the liquid.
- 10 and 14 GPa: the points of Chen et al. (20082, Fig. 1) are read twice, from the vector symbols and from a 600 dpi raster. The 2 reads agree to 0.27 wt% and 3.1 K.
Misfit of the shipped liquidus to the measured points:
| Case | Points | RMS | Mean | Largest |
|---|---|---|---|---|
| 1 bar | 19 | 78.60 K | \(-33.32\) K | 135.0 K |
| 6 GPa | 21 | 153.15 K | \(-141.36\) K | 244.0 K |
| 10 GPa | 7 | 88.95 K | \(-82.55\) K | not stated |
| 14 GPa | 4 | 150.90 K | \(-12.45\) K | not stated |
Change of the liquidus from 10 to 14 GPa:
| Case | Shipped liquidus | Measured liquidus |
|---|---|---|
| 4 wt% S | changes by \(+3.05\) K/GPa | falls by 42.05 K/GPa |
| 8 wt% S | changes by \(-14.49\) K/GPa | falls by 39.06 K/GPa |
| 12 wt% S | changes by \(-26.89\) K/GPa | falls by 15.53 K/GPa |
| Falls from 10 to 14 GPa from | 4.61 wt% S | 1.01 wt% S |
The measured values are linear between the points of Chen et al. (20082). For the measured onset, the 10 GPa data are the chord from the pure-Fe point to the first liquid point at 7.05 wt%. A chord is the straight line between 2 points. So the code puts the onset of top-down freezing at a higher S content than the data.
Pure iron: the 2 pure-iron points at 1 bar, 1800 and 1809 K, lie 22.4 and 13.4 K below the pure-iron curve (1822.4 K at 1 bar). The shipped pure iron melts 12.9 and 35.0 K above the pure-Fe points at 10 and 14 GPa.
Why it matters. The liquidus from 1 bar to 15 GPa decides when the core of a small planet, with all its pressures in that range, starts to freeze, and whether it freezes from the top.
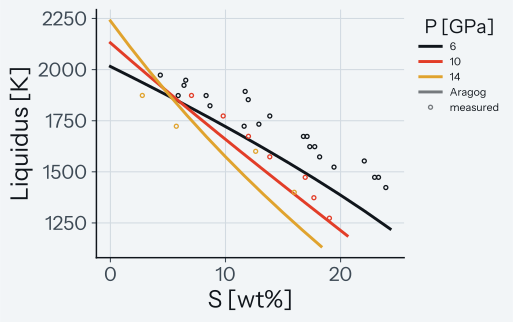
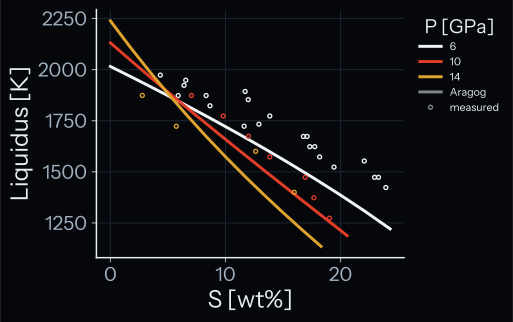
How to read the plot. The x-axis is the S content in wt% and the y-axis the liquidus in K. Each line is the shipped liquidus at one pressure, from pure iron to the eutectic. The circles in the same colour are the measured points. The lines lie below most points, because the ideal form does not follow the measured curvature.
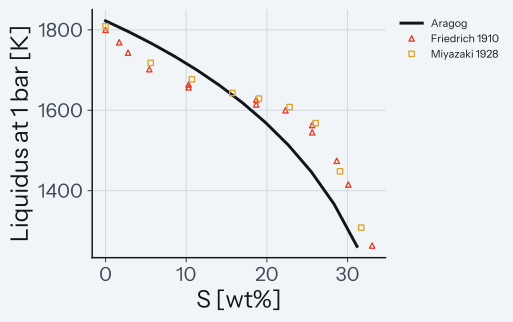
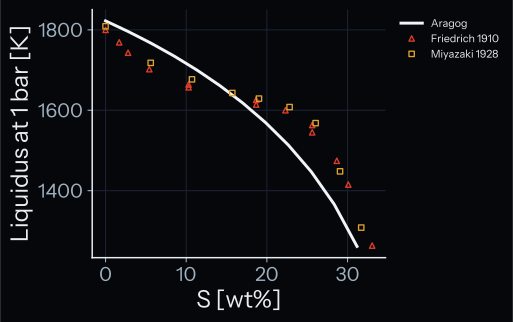
How to read the 1 bar plot. The line is the shipped liquidus from pure iron to the 1 bar eutectic, the triangles and squares the 2 data sets. The line lies above the points up to 11 wt% S (by up to 67 K) and below them from 16 wt% S to the eutectic (by up to 135 K).
Known limit. A non-ideal liquidus below 21 GPa, such as the model of Buono & Walker (20111), is not implemented. The misfit above is the size of that limit. Above 14 GPa the case The low-pressure eutectic and the fits of Mori et al. (201714) and Mashino et al. (201911) take over.
Test details
- Reference: Buono & Walker (20111), Fig. 6, p. 2079, 2 reads, and Table 1, p. 2075; Chen et al. (20082), Fig. 1, 2 reads (
tests/validation/data/core_eutectics/low_pressure/). - Tolerance: RMS and mean to 0.05 K; the 2 reads of the 1 bar points to 0.5 pt, of the Chen et al. points to 0.28 wt% and 3.2 K; slopes to 0.05 K/GPa (code) and 0.005 K/GPa (data).
- Test id:
test_core_alloy_liquidus_low_pressure.py::test_the_low_pressure_liquidus_misses_the_measured_points_as_stated,::test_the_two_reads_of_the_1_bar_points_agree,::test_the_two_reads_of_the_chen_points_agree,::test_from_10_to_14_gpa_the_liquidus_falls_from_a_higher_s_content_than_the_data(unit tier) - Command:
pytest -o "addopts=" tests/test_core_alloy_liquidus_low_pressure.py -k "misses or 1_bar or chen_points or falls_from_a_higher"; the plots:pytest -o "addopts=" tests/test_core_alloy_liquidus_low_pressure.py -k "1_bar or falls_from_a_higher" --validation-plots
The low-pressure eutectic
Why this check exists. A wrong node or a step at a join changes the liquidus of every alloy at these pressures and its slope.
What it tests. Below the Simon fits (21 GPa for S, 5 GPa for C) the eutectic comes from a few measured points, the nodes, joined into the fits. As the end point of every Fe-S and Fe-C liquidus at these pressures, its slope sets the slope of the liquidus near it. The tests check the nodes, the curves through them, the joins to the fits and the misses against measured check points.
Details
- The Fe-S eutectic at 1 bar, 10 and 14 GPa must be the mean of the 2 reads of Fei et al. (19974, Fig. 2), to a relative \(10^{-12}\). The 2 reads must agree to 1.6 C and 0.035 wt%.
- \(T_e\) and \(w_e\) must be the monotone cubic Hermite through the nodes, written out by hand. This is a piecewise cubic curve through the nodes that keeps their trend monotone.
- \(T_e\), \(w_e\) and the liquidus must have no slope step at 10 and 14 GPa.
- The eutectic must be continuous in value and slope at 18 and 21 GPa (S) and, for \(T_e\), at 5 GPa (C).
- Inside 18 to 21 GPa the eutectic must be the smootherstep mean of the line and the fit. A smootherstep is a weight that rises smoothly from 0 to 1.
- The Fe-C eutectic below 5 GPa must be the cubic written out by hand, with \(w_e\) monotone (slope 0 at 5 GPa). It must give the stated liquidus slope step of 2 wt% C at 5 GPa.
- The eutectic must miss each check point by the stated amount: 10 temperatures and 9 compositions from 1 bar to 25 GPa. The Fe-C composition at 1 bar (Lord et al. 200910) equals the node value, so 8 compositions are independent of the nodes.
- At the 2 anchors of the fits (1348 K at 21 GPa, 1513 K at 5 GPa) only the composition is a check.
How we know the right answer. The nodes are 2 reads of a measured phase diagram. The check points are measured eutectics.
Details
- At 6 GPa: Buono & Walker (20111), Ryzhenko & Kennedy (197316), Usselman (197517) and Morard et al. (200713), all from Table 1 of Buono & Walker (20111).
- At 21 GPa: Fei et al. (20005, p. 1831).
- At 21 and 25 GPa: the linear fit of Kamada et al. (20109, p. 98).
- At 21.9 and 23.0 GPa: quench runs with a liquid (Chudinovskikh & Boehler 20073, Table 1). They are upper bounds of the eutectic temperature.
- At 21.9 GPa: a liquid on the Fe-rich liquidus. Its S content bounds the eutectic composition from below.
- For Fe-C: 1 bar (Lord et al. 200910, p. 158) and 5 and 10 GPa (Fei & Brosh 20146, p. 158).
Code minus check point, in temperature:
| Case | Pressure | Reference | Difference |
|---|---|---|---|
| Buono & Walker, Ryzhenko & Kennedy | 6 GPa | 1263 K | \(-42.2\) K |
| Usselman | 6 GPa | measured eutectic | \(-38.2\) K |
| Morard et al. | 6 GPa | measured eutectic, \(\pm 170\) K | \(+80.8\) K |
| Fit of Kamada et al. | 21 GPa | error 54.7 K | \(+36.6\) K, inside the error |
| Fit of Kamada et al. | 25 GPa | error 57.5 K | \(+52.4\) K, inside the error |
| Quench run | 21.9 GPa | upper bound | 148.0 K below |
| Quench run | 23.0 GPa | upper bound | 66.8 K below |
| Fe-C | 1 bar | Lord et al. (200910) | \(-3.85\) K |
| Fe-C | 10 GPa | Fei & Brosh (20146) | \(+77.5\) K (the Mashino fit) |
Code minus check point, in composition:
| Case | Pressure | Reference | Difference |
|---|---|---|---|
| Buono & Walker | 6 GPa | measured eutectic | \(-1.44\) wt% S |
| Ryzhenko & Kennedy | 6 GPa | measured eutectic | \(-1.32\) wt% S |
| Usselman | 6 GPa | measured eutectic | \(-3.45\) wt% S |
| Morard et al. | 6 GPa | measured eutectic | \(-2.78\) wt% S |
| Fei et al. (20005) | 21 GPa | measured eutectic | \(-0.67\) wt% |
| Liquid of Chudinovskikh & Boehler | 21.9 GPa | 13.0 \(\pm\) 1.1 wt% S, a lower bound | \(+1.68\) wt% above, as it should be |
| Fei & Brosh | 5 GPa | measured eutectic | \(+0.31\) wt% C |
The 1512 \(\pm\) 19 K of the 21.9 GPa liquid lie 55.62 K below the liquidus at 13 wt% S.
Why it matters. A wrong eutectic here moves the temperature at which an S- or C-bearing core at these pressures starts to freeze. A wrong eutectic slope can change whether the core freezes from the top or from the centre.
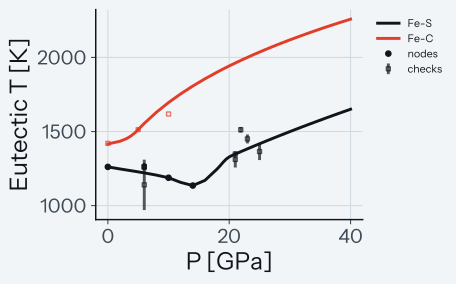
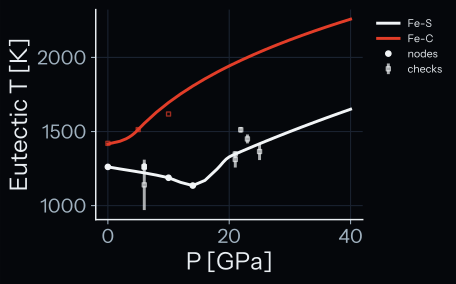
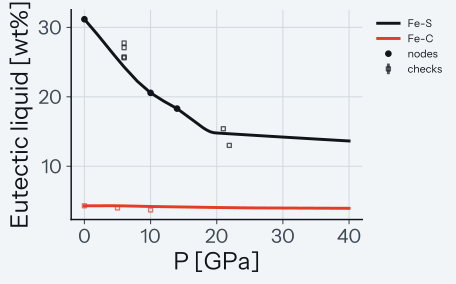
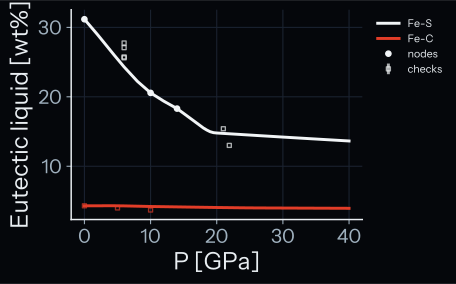
How to read the plots. The x-axis is the pressure in GPa. The y-axis is the eutectic temperature in K (first plot) or the S or C content of the eutectic liquid in wt% (second plot). The lines are the shipped eutectic of Fe-S and Fe-C, and the filled circles the Fe-S nodes. The open squares are the check points in the colour of their binary, with their stated temperature errors as bars. The Fe-S line falls to its minimum at 14 GPa and rises into the Simon fit over 18 to 21 GPa.
Known limit. The 6 GPa eutectic lies 42 K and 1.4 wt% S below the 6 GPa measurements. The nodes at 1 bar and 10 GPa come from one phase diagram. Buono & Walker (20111) find the eutectic temperature constant up to 6 GPa, but the curve between the nodes does not hold it constant. The curve also changes the slope of the S liquidus below 26 GPa, as the note below states.
Details
The monotone Hermite takes the slope steps at 10 and 14 GPa out of the liquidus. It departs from the chord between the nodes by up to \(-25.9\) K in \(T_e\) (15.91 GPa) and \(-0.52\) wt% in \(w_e\) (6.67 GPa). This raises the 6 GPa misfit from 142.14 to 153.15 K RMS.
Below 14 GPa the liquidus of S alloys from about 4 wt% falls with pressure, as the eutectic does:
| Alloy | Falls from | Least slope |
|---|---|---|
| 4.8 wt% S | 10.78 to 13.79 GPa | \(-2.4\) K/GPa |
| 8 wt% S | 4.99 to 15.57 GPa | \(-16.4\) K/GPa |
| 12 wt% S | 1.74 to 16.41 GPa | \(-29.4\) K/GPa |
Alloys with 1 and 3 wt% S keep rising (least slopes 19.5 and 7.2 K/GPa).
The blend of FeS and Fe\(_3\)S units over 18 to 26 GPa adds to the slope near 22 GPa, with no data behind it:
| Alloy | Added slope, up to | Peak slope |
|---|---|---|
| 2 wt% S | 29.6 K/GPa | 51.4 K/GPa |
| 4 wt% S | 53.6 K/GPa | 73.9 K/GPa |
| 8 wt% S | 81.5 K/GPa | 98.4 K/GPa |
| 10 wt% S | 81.8 K/GPa | 96.7 K/GPa |
| 12 wt% S | 67.4 K/GPa | 80.0 K/GPa |
Over the window the depression per wt% S in the dilute limit falls 3.46 times, from 92.72 to 26.80 K.
Test details
- Reference: Fei et al. (19974), Fig. 2, 2 reads; the check points in
tests/validation/data/core_eutectics/low_pressure/low_pressure_eutectic_checks.csv, each with its source and page; the cubic and the smootherstep written out by hand; the unit blend and the falling ranges are the code's own output (physics_invariant). - Tolerance: nodes and cubic to a relative \(10^{-12}\); slopes to \(2 \times 10^{-3}\) K/GPa; misses to 0.02 K and 0.002 wt%; Kamada et al. inside their errors; quench runs above the eutectic; the 21.9 GPa liquid below \(w_e\); anchors: composition only; blend slope to 0.2 K/GPa; falling ranges to 0.015 GPa.
- Test id:
test_core_alloy_liquidus_low_pressure.py::test_the_fe_s_eutectic_nodes_are_the_mean_of_two_reads_of_fei_1997,::test_the_fe_s_eutectic_is_the_monotone_hermite_through_the_nodes,::test_the_eutectic_joins_the_fits_with_a_continuous_slope,::test_the_fe_s_eutectic_inside_the_join_is_the_smootherstep_mean,::test_the_fe_c_eutectic_below_5_gpa_is_the_monotone_cubic,::test_the_low_pressure_eutectic_against_the_check_points,::test_the_unit_blend_adds_the_stated_slope,::test_below_26_gpa_the_s_liquidus_falls_where_the_eutectic_falls(unit tier) - Command:
pytest -o "addopts=" tests/test_core_alloy_liquidus_low_pressure.py; the plots:pytest -o "addopts=" tests/test_core_alloy_liquidus_low_pressure.py -k check_points --validation-plots
The 2 reads of each figure curve
Why this check exists. A read of a figure can follow the wrong line or drift off it.
What it tests. Each curve is read twice: from the vector path of the curve in the PDF (read A) and from a 300 dpi raster image (read B). The largest perpendicular distance from a point of read B to read A must be within the tolerance of the file, in points of the source figure. A second test checks that each eutectic table shipped with Aragog lies on read A of its figure.
How we know the right answer. 2 independent reads of the same drawing. This covers every curve taken from a figure: the eutectic compositions of Fe-S, Fe-C and Fe-O, the Fe-O eutectic temperature and the 8 liquidus curves.
| Case | Largest distance | Tolerance | Ratio |
|---|---|---|---|
| All figure curves | 0.07 to 1.35 pt | 0.35 to 2.34 pt | at most 0.80 of the tolerance |
Why it matters. The eutectic tables of Aragog and the reference curves of the cases above come from these reads.
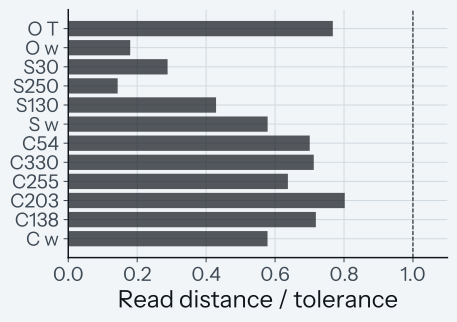
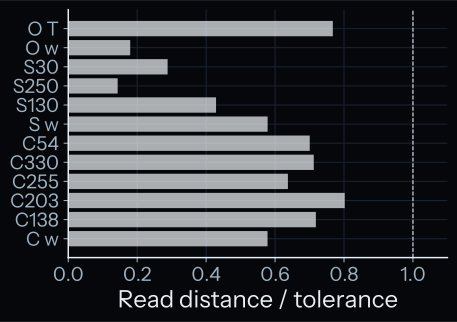
How to read the plot. Each bar is one data file. Its label is X and a pressure in GPa for a liquidus curve. "X w" marks a eutectic composition and "O T" the Fe-O eutectic temperature. The bar length is the largest distance between the 2 reads over the tolerance of the file. A pass means that every bar ends left of the dashed line at 1. The test allows 0.02 pt above the tolerance.
Known limit. The second read of the Fe-O composition has no points from 42 to 52 GPa, where an open symbol in the colour of the curve lies on it.
Test details
- Reference: read A and read B of each curve (
tests/validation/data/core_eutectics/). - Tolerance: the tolerance in the header of each file, plus 0.02 pt. It is half the drawn line width, or the full width for the thin Fe-O temperature line. Shipped tables equal to read A within \(6 \times 10^{-6}\) (mass fraction) or 0.06 K.
- Test id:
::test_the_two_reads_of_each_figure_curve_agree,::test_the_two_reads_figure,::test_the_shipped_tables_are_the_first_read(unit tier) - Command:
pytest -o "addopts=" tests/test_core_alloy_liquidus.py -k "reads or first_read"
Related tests
The other tests in tests/test_core_alloy_liquidus.py check that:
- a composition past the eutectic is held at its boundary and flagged;
- at 255 GPa the liquidus is the mean of its Fe\(_3\)C and Fe\(_7\)C\(_3\) forms;
- the gradient of an alloy without S, C and O passes
jax.debug_nans; - above the data the eutectic composition continues its last table segment, while the eutectic temperature becomes homologous, both flagged;
- O is flagged beyond its composition table at 325 GPa;
- the composition slope at zero light element is the dilute slope;
- a traced or 0-d array composition works like a float;
- invalid compositions and a binary with \(A \le 0\) are refused;
- with Hypothesis, every valid alloy melts at or below pure iron;
- with Hypothesis, more S never raises the liquidus on the Fe-rich side.
The other tests in tests/test_core_alloy_liquidus_low_pressure.py check that:
- the S and C data start at 1 bar, so nothing below 21 or 5 GPa is flagged;
- at a negative pressure, below the start of the data (1 bar, written 0 GPa), the eutectic is held homologous and flagged;
- the Fe-S liquidus is the ideal form on FeS units below 18 GPa, on Fe\(_3\)S units from 26 GPa and their mean at 22 GPa;
- the Fe-C liquidus below 18 GPa is the Fe\(_3\)C form written out by hand;
- a mixture of S, C and O takes the S units of its pressure;
- Fe\(_3\)S units hold the eutectic from 17.14 GPa;
- the S and C blends do not overlap, and the joins sit at the starts of the tables;
- the gradient of alloys below 30 GPa passes
jax.debug_nans; - at every node and join of the eutectic tables, the blends and the fade, the gradient equals the gradient just below or just above it (
::test_the_gradient_at_a_table_node_is_a_one_sided_gradient).
Limits
These cases leave out 3 topics: the partition of light elements between solid and liquid, the energy budget of an inner core with an alloy liquidus, and a coupled run. They belong to the core energy budget (core).
-
Buono, A.S. & Walker, D., The Fe-rich liquidus in the Fe-FeS system from 1 bar to 10 GPa, Geochimica et Cosmochimica Acta, 75, 2072-2087, 2011. SciX. ↩↩↩↩↩↩↩↩
-
Chen, B., Li, J. & Hauck, S.A., Non-ideal liquidus curve in the Fe-S system and Mercury's snowing core, Geophysical Research Letters, 35, L07201, 2008. SciX. ↩↩↩↩↩
-
Chudinovskikh, L. & Boehler, R., Eutectic melting in the system Fe-S to 44 GPa, Earth and Planetary Science Letters, 257, 97-103, 2007. SciX. ↩
-
Fei, Y., Bertka, C.M. & Finger, L.W., High-Pressure Iron-Sulfur Compound, Fe\(_3\)S\(_2\), and Melting Relations in the Fe-FeS System, Science, 275, 1621-1623, 1997. ↩↩
-
Fei, Y., Li, J., Bertka, C.M. et al., Structure type and bulk modulus of Fe\(_3\)S, a new iron-sulfur compound, American Mineralogist, 85, 1830-1833, 2000. SciX. ↩↩
-
Fei, Y. & Brosh, E., Experimental study and thermodynamic calculations of phase relations in the Fe-C system at high pressure, Earth and Planetary Science Letters, 408, 155-162, 2014. SciX. ↩↩
-
Friedrich, K., Metallurgie, 9, 33-48, 1910. ↩
-
Hansen, M. & Anderko, K., Constitution of Binary Alloys, 2nd edition, McGraw-Hill, New York, p. 1305, 1958. ↩
-
Kamada, S., Terasaki, H., Ohtani, E. et al., Phase relationships of the Fe-FeS system in conditions up to the Earth's outer core, Earth and Planetary Science Letters, 294, 94-100, 2010. SciX. ↩
-
Lord, O.T., Walter, M.J., Dasgupta, R. et al., Melting in the Fe-C system to 70 GPa, Earth and Planetary Science Letters, 284, 157-167, 2009. SciX. ↩↩↩
-
Mashino, I., Miozzi, F., Hirose, K. et al., Melting experiments on the Fe-C binary system up to 255 GPa: Constraints on the carbon content in the Earth's core, Earth and Planetary Science Letters, 515, 135-144, 2019. SciX. ↩↩↩↩↩↩↩↩↩↩
-
Miyazaki, K., Science Reports of the Tohoku Imperial University, 17, 877-881, 1928. ↩
-
Morard, G., Sanloup, C., Fiquet, G. et al., Structure of eutectic Fe-FeS melts to pressures up to 17 GPa: Implications for planetary cores, Earth and Planetary Science Letters, 263, 128-139, 2007. SciX. ↩
-
Mori, Y., Ozawa, H., Hirose, K. et al., Melting experiments on Fe-Fe\(_3\)S system to 254 GPa, Earth and Planetary Science Letters, 464, 135-141, 2017. SciX. ↩↩↩↩↩↩↩↩↩↩↩↩
-
Oka, K., Hirose, K., Tagawa, S. et al., Melting in the Fe-FeO system to 204 GPa: Implications for oxygen in Earth's core, American Mineralogist, 104, 1603-1607, 2019. SciX. ↩↩↩↩↩
-
Ryzhenko, B. & Kennedy, G.C., The effect of pressure on the eutectic in the system Fe-FeS, American Journal of Science, 273, 803-810, 1973. SciX. ↩
-
Usselman, T.M., Experimental approach to the state of the core; Part I, The liquidus relations of the Fe-rich portion of the Fe-Ni-S system from 30 to 100 kb, American Journal of Science, 275, 278-290, 1975. SciX. ↩