The core alloy liquidus
What this is and why it matters
At what temperature does an iron core with light elements start to freeze? The liquidus of an alloy is the temperature at which it starts to freeze as it cools. In a planet's core, the inner core grows where the core adiabat meets the liquidus of the core alloy. The adiabat is the temperature profile at constant entropy, which a well-mixed convecting liquid follows. Light elements such as sulfur, carbon and oxygen lower the liquidus of iron, so they move the inner-core boundary. The slope of the liquidus, compared with the slope of the adiabat, also decides whether the core freezes from the centre or from the top.
A sketch of the liquidus
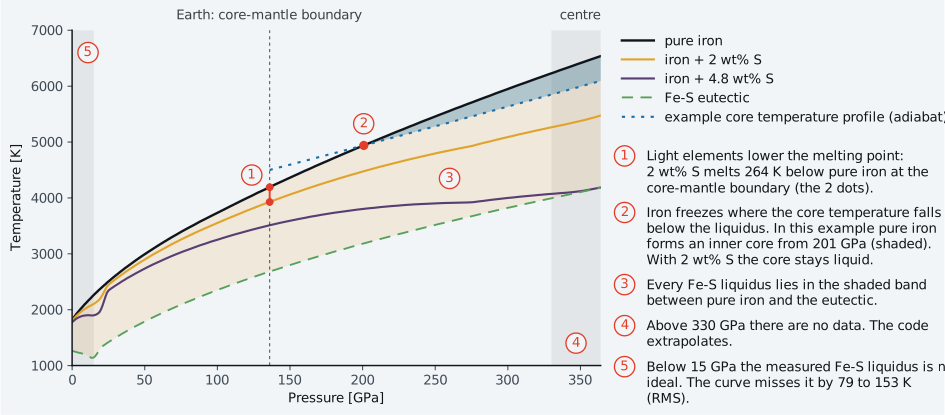
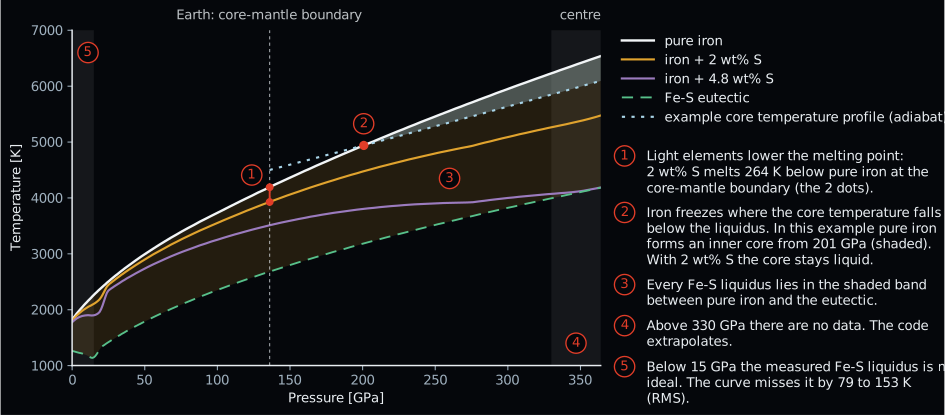
The figure shows melting temperature against pressure, from the surface to the centre of the Earth at 364 GPa: pure iron and iron with 2 and 4.8 wt% S (percent by mass), from IronMeltingCurve and AlloyLiquidus, and the Fe-S eutectic (dashed), the lowest melting point of the mixture, from eutectic. The dotted curve is an example core temperature profile, 4500 K at the core-mantle boundary with the slopes of the default core adiabat, not a model result. The notes beside the plot explain the 5 numbered points. tools/verification/figures/sketch_alloy_liquidus.py builds the figure.
The model in steps
aragog.core.AlloyLiquidus builds the liquidus in three steps. First it treats each binary alone. A binary is iron with one light element X. Then it joins the binaries for an alloy with several light elements.
Last, it takes the eutectic point of each binary from published data. The eutectic point is the temperature \(T_e\) and composition \(w_e\) at which iron and a compound of X freeze together. It is the lowest point of the liquidus on the iron side.
S, C and O lower the melting point of iron. Si, H and N are treated as if they do not lower it. AlloyLiquidus has the t_melt(pressure) interface of the other melting curves of the core module (core boundary conditions).
The core_module configuration selects the iron or quadratic curve. AlloyLiquidus is used through the Python API (tutorial).
One binary
How does one light element lower the melting point of iron? On the iron-rich side the liquidus falls from the melting point of pure iron to the eutectic. Aragog writes it as an ideal solution through these 2 points, with one constant \(A\) per binary and pressure. For example, at the core-mantle boundary of the Earth, 136 GPa, iron with 2 wt% S (percent by mass) melts 264 K below pure iron (note 1 of the figure).
The ideal-solution form
On the Fe-rich side of an Fe-X binary, pure solid iron is in equilibrium with the liquid alloy. The Fe-rich side is the range of compositions between pure iron and the eutectic. Mori et al. (201711, Eq. 3) and Mashino et al. (201910) describe this liquidus as an ideal solution:
Here \(x_\mathrm{Fe}\) is the mole fraction of free Fe in the liquid. \(T_\mathrm{Fe}(P)\) is the melting curve of pure iron, the PALEOS curve of Anzellini et al. (20131). \(A\) is a constant at each pressure.
\(A\) follows from the eutectic point. At the eutectic composition \(w_e\) the liquidus equals the eutectic temperature \(T_e\), so
The liquidus therefore runs from \(T_\mathrm{Fe}\) at \(w = 0\) to \(T_e\) at \(w = w_e\).
The units of the alloy
The mole fraction counts Fe against the Fe\(_k\)X\(_m\) units of the alloy, not against single X atoms. The units are:
- S: FeS below 18 GPa and Fe\(_3\)S above 26 GPa.
- O: FeO.
- C: Fe\(_3\)C below 255 GPa and Fe\(_7\)C\(_3\) above.
On the Fe\(_3\)S units this form reproduces the 3 liquidus curves that Mori et al. (201711, Fig. 9) draw. On S atoms it does not (validation). For C the units are not verified. The curves of Mashino et al. (201910, Fig. 8) are closer to straight lines than to this form.
Joining two units
Where the unit changes, Aragog blends the liquidus temperatures of the two units with a \(C^2\) smootherstep. A smootherstep is a polynomial weight that rises from 0 to 1 across a pressure window. \(C^2\) means that the blend, its slope and its curvature have no step.
Carbon. The 2 C units give liquidus temperatures that differ by up to 55 K at 255 GPa. Aragog joins them with a \(C^2\) smootherstep over 230 to 280 GPa, so the liquidus has no step.
Details
Across the blend the slope of the liquidus falls at most 0.76 K/GPa (at 2 wt% C) below the lower of its values at 229 and 281 GPa. These two pressures lie just outside the blend. There the slopes are 1.6 to 9.3 K/GPa for 0.5 to 3 wt% C.
Sulfur. The sulfide that coexists with iron at the Fe-S eutectic is FeS up to 14 GPa. Above it the sulfide is Fe\(_3\)S\(_2\) (Fei et al. 19974). Fe\(_3\)S forms between 18 and 21 GPa (Fei et al. 20005).
Fe\(_3\)S units hold at most 16.06 wt% S. This is less than the S in the eutectic liquid below 17.14 GPa. Aragog therefore uses FeS units up to 18 GPa and Fe\(_3\)S units from 26 GPa. A \(C^2\) smootherstep of the 2 liquidus temperatures joins them over 18 to 26 GPa.
Fe\(_3\)S\(_2\) and Fe\(_2\)S are not used as units. The FeS and Fe\(_3\)S forms run through the same end points but differ between them. The blend therefore adds to the slope of the liquidus near 22 GPa, with no data behind it.
The dilute limit is the limit of a vanishing light-element content, \(w \to 0\). Over the window, the depression per wt% S in the dilute limit falls 3.46 times. It falls from 92.72 K at 18 GPa (FeS units) to 26.80 K at 26 GPa (Fe\(_3\)S units).
Details
Between the end points the two forms differ by up to 357.7 K at 21 GPa (9.15 wt% S). At 18 GPa they differ by 457.7 K (10.32 wt% S), but there the Fe\(_3\)S form has zero weight.
The slope it adds near 22 GPa, up to 81.8 K/GPa, is listed per S content in the case The low-pressure eutectic.
Where the form misses the Fe-S data at low pressure
From 1 bar to 15 GPa the measured Fe-S liquidus is not ideal (Buono & Walker 20112; Chen et al. 20083). The ideal form on FeS units misses the measured points. The RMS misfit is the root mean square of the differences between the form and the points.
Between 10 and 14 GPa the measured liquidus falls faster than the ideal form at 4 and 8 wt% S. The code also puts the onset of top-down freezing at a higher S content than the data. A non-ideal liquidus below 21 GPa, such as the model of Buono & Walker (20112), is not implemented.
The form misses the measured points by 79 to 153 K RMS from 1 bar to 14 GPa. The misfit at each pressure and the change of the liquidus from 10 to 14 GPa are in the case The Fe-S liquidus from 1 bar to 15 GPa.
Where this is checked. The end points of each binary, the Fe-S liquidus curves of Mori et al. (2017), the Fe-C liquidus curves of Mashino et al. (2019) and the Fe-S liquidus from 1 bar to 15 GPa.
Several elements
How do several light elements combine? Aragog keeps one ideal-solution form and combines the binary constants as a harmonic mean, weighted by the mole fractions. For a dilute alloy the depression is then the sum of the binary depressions. For example, the alloy of the tutorial (2 wt% S, 0.5 wt% C, 3 wt% O and 4 wt% Si) melts 613 K below pure iron at 135 GPa.
With several elements the mole fraction of free Fe is \(x_\mathrm{Fe} = 1 - X\), with \(X = \sum_i x_i\). The constant is a harmonic mean of the binary constants, weighted by the mole fractions:
For a dilute alloy this gives \(T_\mathrm{Fe} - T \approx T_\mathrm{Fe} \sum_i x_i / A_i\). This is the sum of the dilute depressions of the binaries.
Silicon. Si is treated as lowering no melting point. Its atoms count with the Fe of the solvent, so an Fe-Si alloy melts like Fe. Si still dilutes the S, C and O units. For example, 6 wt% Si raises the liquidus of a 2 wt% S alloy by 15 K at 135 GPa.
Hydrogen and nitrogen. Aragog has no liquidus data for H and N, so they leave the mole count. An alloy melts like the same alloy without its H and N, with the rest renormalised. It is also held at its eutectic like that alloy.
Past the eutectic. A composition past the Fe-rich side of the eutectic, \(\sum_i w_i / w_{e,i} > 1\), would crystallise a compound, not iron. There the liquidus is held at its value on the boundary, with the composition scaled to \(\sum_i w_i / w_{e,i} = 1\). AlloyLiquidus.status flags the pressure (past_eutectic).
Where this is checked. Several light elements.
Eutectic data
Where do the eutectic points come from? Each binary needs its eutectic temperature and composition at every pressure. Aragog reads them from measured points at low pressure and from fits and figure curves at high pressure, and continues them above the data by a rule. The data sources table lists every source.
Low pressure
The data of all 3 binaries start at 1 bar, written 0 GPa. At a negative pressure the eutectic temperature keeps its ratio to \(T_\mathrm{Fe}\) at 0 GPa. This fixed ratio to the pure-iron melting point is called homologous. The eutectic composition keeps its 0 GPa value.
Fe-S. Fei et al. (19974, Fig. 2) give the eutectic at 1 bar, 10 and 14 GPa. These points are the nodes. From the nodes, \(T_e\) runs towards 1348 K at 21 GPa (Fei et al. 20005), and \(w_e\) runs towards the composition curve at 20 GPa.
Through the nodes and these line ends, \(T_e\) and \(w_e\) follow the monotone cubic Hermite of Fritsch & Carlson (19807). This piecewise cubic stays monotone between the nodes and has no step in slope at them. Over 18 to 21 GPa a smootherstep \(b\) of \((P - 18\,\mathrm{GPa})/3\,\mathrm{GPa}\) joins these lines into the high-pressure Simon fit (a power law of pressure for the eutectic temperature, below) and composition table:
\(T_e = (1 - b)\,T_\mathrm{line} + b\,T_\mathrm{fit}\) and the same for \(w_e\).
The composition table is continued below 20 GPa along its first segment. \(T_e\), \(w_e\) and their slopes are continuous at 18 and 21 GPa.
Details
The Fe-S nodes are the means of 2 reads of Fei et al. (19974, Fig. 2), which agree to 1.5 C and 0.03 wt% (fe_s_low_pressure.csv):
| Pressure | \(T_e\) | \(w_e\) |
|---|---|---|
| 1 bar | 1261.25 K | 31.175 wt% S |
| 10 GPa | 1187.9 K | 20.57 wt% S |
| 14 GPa | 1135.25 K | 18.305 wt% S |
The node slopes of the Hermite are:
- At 1 bar: the first chord.
- At 10 GPa: the weighted harmonic mean of the 2 secants.
- At 14 GPa: 0. Here Fe\(_3\)S\(_2\) appears and \(T_e\) has its minimum.
- At the join end: the slope of the fit and of the table.
The slopes of \(T_e\) and \(w_e\), and so of the liquidus, have no step at 10 and 14 GPa. A line between the nodes would put a step there with no data behind it (up to 38.6 K/GPa for 12 wt% S at 14 GPa).
The curve departs from the chord between the nodes. \(T_e\) departs by up to \(-25.9\) K at 15.91 GPa. \(w_e\) departs by up to \(-0.52\) wt% at 6.67 GPa. The 6 GPa misfit of the liquidus therefore grows from 142.14 to 153.15 K RMS (22 to 21 points). The eutectic misses Buono & Walker (20112) at 6 GPa by \(-42.2\) K and \(-1.44\) wt%, instead of \(-45.8\) K and \(-0.94\) wt%.
At 18 GPa \(w_e\) is 15.50 wt% S. This is below the 16.06 wt% that Fe\(_3\)S units hold. \(w_e\) crosses that value at 17.14 GPa.
Fe-C. Below 5 GPa the Fe-C eutectic is a cubic. It runs through 1416.15 K and 4.3 wt% C at 1 bar (Nakajima et al. 200912, p. 207), with zero curvature there. At 5 GPa it takes the value of the Mashino fit and composition table.
Details
At 5 GPa \(T_e\) takes the slope of the fit, and \(w_e\) the slope 0. Both stay monotone (Fritsch & Carlson 19807). For \(w_e\) the slope 0 is needed, because the table falls at 5 GPa where the chord from 1 bar rises.
\(T_e\) rises by 7.09 K/GPa at 1 bar and 43.93 K/GPa at 5 GPa. It is convex, because the join takes the slope of the Mashino fit at 5 GPa. That slope is 2.1 times the 21.0 K/GPa that Fei & Brosh (20146, p. 158) measure from 5 to 10 GPa.
\(w_e\) runs from 4.300 to 4.311 wt%. Its slope steps from 0 to that of the table at 5 GPa. The liquidus slope of 0.5 to 3 wt% C steps with it, by \(-0.37\) to \(-2.60\) K/GPa (2 wt% C: from 36.56 to 34.93 K/GPa).
High pressure
A Simon fit is a power law of pressure for a melting temperature. From 21 GPa the Fe-S eutectic temperature is the Simon fit of Mori et al. (201711, p. 138), \(T_e = 1348\,\mathrm{K}\,[(P - 21)/36.5 + 1]^{1/2.07}\), with \(P\) in GPa. From 5 GPa the Fe-C eutectic temperature is the Simon fit of Mashino et al. (201910, p. 138), \(T_e = 1513\,\mathrm{K}\,[(P - 5)/8.4 + 1]^{1/4.1}\). The Fe-O eutectic temperature is the curve of Oka et al. (201913, Fig. 4).
The eutectic compositions are curves read from published figures. For S and C the read curve ends before 330 GPa. A straight segment then runs from the last table node to an anchor, a fixed end value at 330 GPa (data sources). The pressures between the end of each read curve and its anchor at 330 GPa count as data.
The eutectic equals the data up to the end of each range.
Details
Mashino et al. (201910, p. 140) give about 3 wt% C for the eutectic at 330 GPa in their text. With that value the eutectic composition falls 4 times faster from 270 to 330 GPa than at the end of their curve. The liquidus of 2 to 3 wt% C then falls with pressure there (down to \(-4.6\) K/GPa for 3 wt% C). The end of their 330 GPa liquidus curve in Fig. 8, 3.35 wt%, keeps the slope positive and is used.
Above the data
Above the end of the data, \(P_\mathrm{end}\), the data are taken at an effective pressure \(q\). Its slope \(dq/dP = 1 - b\) fades from 1 to 0 by a smootherstep \(b\) over the 40 GPa above the end of the data. This window is 330 to 370 GPa for S and C, and 325 to 365 GPa for O. The effective pressure is
\(q = P_\mathrm{end} + 2h\,[z - z^4 (5/2 - 3z + z^2)]\) with \(z = (P - P_\mathrm{end})/2h\) and \(h = 20\) GPa, so \(q\) ends at \(P_\mathrm{end} + h\).
The eutectic temperature there is \(T_e(q)\, T_\mathrm{Fe}(P) / T_\mathrm{Fe}(q)\). It keeps its ratio to the pure-iron curve at \(q\) (homologous). It does not follow the Simon fit or the Fe-O table at \(P\). The composition tables and the Fe-O temperature table continue along their last segment up to \(q\).
From 40 GPa above the end, \(q\) stays at \(P_\mathrm{end} + h\). The eutectic composition keeps its value there: 4.81 wt% S, 3.27 wt% C and 15.28 wt% O. AlloyLiquidus.status flags pressures outside the data (extrapolated) for each depressing element in the alloy.
The continued compositions move above the data. An alloy whose \(\sum_i w_i / w_{e,i}\) passes 1 there therefore crosses its eutectic once, by extrapolation. At the crossing the slope of the liquidus steps up, by 0.3 to 3.7 K/GPa for the alloys tested.
Details
The continued tables move the composition by \(-0.19\) wt% S, \(-0.08\) wt% C and \(+0.22\) wt% O from the end of the data. The continued slope is that of the last table segment. For O this is the last segment of the read curve. For S and C it is the straight segment from the last read node (275 and 270 GPa) to the 330 GPa anchor, not a measured slope.
The slope of the liquidus changes smoothly into the homologous rule. Between points 0.1 GPa apart over 325 to 380 GPa, it moves by at most 0.025 K/GPa for the alloys tested.
S and C alloys and their mixtures enter their eutectic above the data, since the S and C tables fall. The pressures of the crossings are listed in the case The slope of the liquidus.
O alloys between 15.07 and 15.28 wt% leave it, since the O table rises: 15.2 wt% at 338 GPa, 15.28 wt% at 354 GPa.
Inside the data, where the alloy is not past its eutectic, the slope keeps the kinks of the table nodes. The largest kinks, between points 0.1 GPa apart, are of the size of the step where an alloy passes its eutectic:
- 3.4 K/GPa for 4.8 wt% S at 275 GPa, where the read curve joins the straight segment to the 330 GPa anchor. For the mixture of 2 wt% S, 0.5 wt% C and 3 wt% O the kink there is 1.6 K/GPa.
- 1.0 K/GPa for 3 wt% C at 25 and 270 GPa.
- 2.5 K/GPa for 10 wt% O at 55 GPa.
At the low-pressure Fe-S nodes the slope has no step. The joins at 18 and 21 GPa (S) add none either. The Fe-C join at 5 GPa adds the small step of the composition slope described under Low pressure.
Alloys past their eutectic at low pressure leave it with a step:
- The alloy of the tutorial is past its eutectic boundary (\(\sum_i w_i / w_{e,i} > 1\)), with three quarters of the sum from O. It leaves it at 20.54 GPa, where the slope steps from 27.97 to 41.49 K/GPa.
- 10 wt% O leaves it at 49.75 GPa, where the slope steps from 10.24 to 15.90 K/GPa.
Where this is checked. Eutectic temperatures, the low-pressure eutectic, the slope of the liquidus and the 2 reads of each figure curve.
Data sources
| Source | Binary | Pressure range | What it gives |
|---|---|---|---|
| Anzellini et al. (20131) | pure Fe | all pressures | Melting curve \(T_\mathrm{Fe}(P)\) of pure iron (the PALEOS prescription). |
| Fei et al. (19974, Fig. 2) | Fe-S | 1 bar, 10 and 14 GPa | Nodes of \(T_e\) and \(w_e\). The sulfide at the eutectic: FeS up to 14 GPa, Fe\(_3\)S\(_2\) above. |
| Fei et al. (20005) | Fe-S | 18 to 21 GPa | \(T_e\) = 1348 K at 21 GPa, the end of the low-pressure curve. Fe\(_3\)S forms between 18 and 21 GPa. |
| Mori et al. (201711, p. 138) | Fe-S | from 21 GPa | Simon fit of \(T_e\). |
| Mori et al. (201711, Fig. 5) | Fe-S | from 21 GPa, read to 275.8 GPa and tabled to its 275 GPa node | Curve of \(w_e\). |
| Hirose et al. (20218) | Fe-S | 330 GPa | Anchor of \(w_e\) at 5 wt% S, reached linearly from the 275 GPa node. |
| Nakajima et al. (200912, p. 207) | Fe-C | 1 bar | 1416.15 K and 4.3 wt%, the start of a cubic to 5 GPa. |
| Mashino et al. (201910, p. 138) | Fe-C | from 5 GPa | Simon fit of \(T_e\). |
| Mashino et al. (201910, Fig. 3) | Fe-C | from 5 GPa, read to 273 GPa and tabled to its 270 GPa node | Curve of \(w_e\). |
| Mashino et al. (201910, Fig. 8) | Fe-C | 330 GPa | Anchor of \(w_e\) at 3.35 wt% C, the end of their 330 GPa liquidus, reached linearly from the 270 GPa node. |
| Oka et al. (201913, Fig. 4) | Fe-O | read to 330 GPa | Curve of \(T_e\). |
| Oka et al. (201913, Fig. 3) | Fe-O | read to 325 GPa | Curve of \(w_e\). |
The data cover 1 bar to 330 GPa for Fe-S and Fe-C, and 0 to 325 GPa for Fe-O.
The curves were read from the vector paths of the published figures. A second read from a raster image checked them. The tables are in aragog/core/eutectics/, each with its source in the header.
Bounds and what happens outside them
What does AlloyLiquidus do outside its valid inputs? It refuses an invalid composition or result, holds a composition past the eutectic at its boundary and continues the eutectic outside the data, with a flag.
- Composition. The mass fractions must be finite real numbers, not negative, of the known elements (S, C, O, Si, H, N), and sum below 1. Otherwise
AlloyLiquidusraises aValueError. - Past the eutectic. A composition with \(\sum_i w_i / w_{e,i} > 1\) over S, C and O is held at its value on the eutectic boundary.
AlloyLiquidus.statusflags the pressure (past_eutectic). - Above the data. Above 330 GPa (S, C) or 325 GPa (O) the eutectic temperature keeps its ratio to the pure-iron curve at an effective pressure. The eutectic composition moves along its last table segment over the next 40 GPa and then stays constant (above the data).
AlloyLiquidus.statusflags the pressure (extrapolated) for each depressing element in the alloy. - Negative pressure. Below the start of the data (1 bar, written 0 GPa) the eutectic temperature keeps its ratio to the pure-iron curve at 0 GPa and the composition its 0 GPa value.
AlloyLiquidus.statusflags the pressure (extrapolated). - Result. A liquidus that is not finite, not above 0 K or above the pure-iron curve, or a binary with \(A \le 0\), raises a
ValueError. - Traced values. The
ValueErrorchecks run only on concrete values. Insidejax.jitor a gradient, an invalid composition or result is not refused.
Where this is checked. The tests listed under related tests and the crossings above the data in the slope of the liquidus.
Limits
-
The ideal form is a fit to the eutectic points, not ideal thermodynamics: its constants give entropies of fusion of 0.1\(R\) to 3.5\(R\), against 1.16\(R\) for iron in the core module.
Details
For a truly ideal solution, \(A\) is the entropy of fusion of iron over \(R\), the gas constant, and is the same for every binary. Over their data the binaries give these values of \(A\):
- S on FeS: 3.50 at 1 bar, 0.45 at 21 GPa.
- S on Fe\(_3\)S: 2.47 at 18 GPa, where the blend weight of that form starts from 0. Then 1.79 at 21 GPa, down to 0.21 at 330 GPa.
- C: from 1.73 (Fe\(_3\)C, 16 GPa) and 0.50 (Fe\(_7\)C\(_3\), 17 GPa) down to 0.40 and 0.12 at 330 GPa.
- O: 1.07 (1 bar) to 3.45 (50 GPa).
The value for iron comes from
ds_fusion172.8 J/kg/K of the core module. The dilute slopes of the shipped liquidus, \(T_\mathrm{Fe} - T\) per wt% as \(w \to 0\):Binary (units) 1 bar 21 GPa 135 GPa 330 GPa Fe-S (FeS, blend at 21 GPa, Fe\(_3\)S) 9.1 K 73.5 K 124.7 K 510.4 K Fe-O (FeO) 59.3 K 33.0 K 66.8 K 137.7 K Fe-C (Fe\(_3\)C, Fe\(_7\)C\(_3\) at 330 GPa) 54.7 K 65.7 K 226.9 K 792.0 K -
Close to its eutectic the liquidus falls with pressure where the eutectic composition falls fast, down to \(-0.64\) K/GPa. A core in this state freezes from the top, which the core module treats as a regime it does not model (crystallisation regimes).
Near the eutectic, \(dT/dP \approx dT_e/dP - |\partial T/\partial w|\,|dw_e/dP|\). The cases where the liquidus falls are listed in The slope of the liquidus.
-
Below 14 GPa the Fe-S eutectic temperature falls with pressure (Fei et al. 19974), and so does the liquidus of S alloys from about 4 wt%, down to \(-29.4\) K/GPa.
The ranges are listed in The low-pressure eutectic.
-
Only the end points of each binary are data, and the liquidus between them follows the form: from 1 bar to 15 GPa the form misses the measured Fe-S liquidus by 79 to 153 K RMS (see One binary).
- The blend of the FeS and Fe\(_3\)S units over 18 to 26 GPa has no data behind it. Near 22 GPa it adds up to 81.8 K/GPa to the slope of the liquidus (see One binary).
-
Below 5 GPa the Fe-C eutectic has 2 data points, 1 bar and 5 GPa, so the cubic between them is a choice. Lord et al. (20099, p. 158) give 1420 K at 1 bar, 3.85 K above the value used.
-
Ternary data (Hirose et al. 20218) are not used to check the harmonic rule.
- The harmonic rule has no ternary eutectic, so a mixture on its eutectic boundary does not melt below the lowest binary eutectic. On a grid of 5151 boundary mixtures of S, C and O the least liquidus is the lowest binary eutectic itself, at the pure binary: 2672 K (S) at 135 GPa and 3713 K (C) at 330 GPa.
- An alloy past its eutectic is held at the boundary by scaling all its S, C and O by one factor. The held liquidus therefore depends on the whole composition, not on a path of the phase diagram. At 135 GPa, adding up to 12 wt% O to 11.2 wt% S (past its 9.35 wt% eutectic) raises it by up to 238 K.
- The
extrapolatedflag starts at the end of the tables, 330 GPa for S and C and 325 GPa for O. This is above the highest pressure of each set of experiments: 254 GPa for Fe-S (Mori et al. 201711, p. 135), 255 GPa for Fe-C (Mashino et al. 201910, p. 135) and 204 GPa for Fe-O (Oka et al. 201913, p. 1603). Above those pressures the eutectic comes from the fits, the read curves and the 330 GPa anchors. - The blend of the 2 C units has no data behind it. At 255 GPa it lowers the slope of the liquidus by 1.5, 2.0 and 1.3 K/GPa (20 to 42 %) below the mean slope of the 2 unit forms, for 1, 2 and 3 wt% C.
- Aragog has no liquidus data for H and N, and they do not enter the liquidus.
AlloyLiquidusis not a melting curve of the core energy budget. The budget takesironorquadratic, and its outer-core enrichment guard reads the light-element fraction of those curves.- The solid takes up no light element in this liquidus. Solid-liquid partitioning belongs to the core energy budget.
-
The slope
AlloyLiquidus.gradientsets whether a core freezes from the centre. Where the liquidus is shallower than the adiabat, iron freezes first at the top (crystallisation regimes). A liquidus that rises with pressure can still be shallower: at 330 GPa the liquidus of the alloys tested rises by 2.0 to 5.5 K/GPa, against 7.2 K/GPa for the adiabat.Details
The adiabat is that of the default core profile, from the core module defaults: central density 12500 kg/m\(^3\), length scale 7272 km, thermal expansivity \(1.35 \times 10^{-5}\) K\(^{-1}\), heat capacity 840 J/kg/K. The core radius is 3480 km, with 136 GPa at the core-mantle boundary. For 4137 K at the core-mantle boundary the adiabat rises by 6.7 K/GPa at 136 GPa and 7.2 K/GPa at 330 GPa. The liquidus of 2 and 4.8 wt% S, 2 wt% C and the alloy of the tutorial rises by 2.0 to 5.5 K/GPa at 330 GPa.
-
Anzellini, S., Dewaele, A., Mezouar, M. et al., Melting of Iron at Earth's Inner Core Boundary Based on Fast X-ray Diffraction, Science, 340, 464-466, 2013. SciX. ↩↩
-
Buono, A.S. & Walker, D., The Fe-rich liquidus in the Fe-FeS system from 1 bar to 10 GPa, Geochimica et Cosmochimica Acta, 75, 2072-2087, 2011. SciX. ↩↩↩
-
Chen, B., Li, J. & Hauck, S.A., Non-ideal liquidus curve in the Fe-S system and Mercury's snowing core, Geophysical Research Letters, 35, L07201, 2008. SciX. ↩
-
Fei, Y., Bertka, C.M. & Finger, L.W., High-Pressure Iron-Sulfur Compound, Fe\(_3\)S\(_2\), and Melting Relations in the Fe-FeS System, Science, 275, 1621-1623, 1997. ↩↩↩↩↩
-
Fei, Y., Li, J., Bertka, C.M. et al., Structure type and bulk modulus of Fe\(_3\)S, a new iron-sulfur compound, American Mineralogist, 85, 1830-1833, 2000. SciX. ↩↩↩
-
Fei, Y. & Brosh, E., Experimental study and thermodynamic calculations of phase relations in the Fe-C system at high pressure, Earth and Planetary Science Letters, 408, 155-162, 2014. SciX. ↩
-
Fritsch, F.N. & Carlson, R.E., Monotone Piecewise Cubic Interpolation, SIAM Journal on Numerical Analysis, 17, 238-246, 1980. SciX. ↩↩
-
Hirose, K., Wood, B. & Vočadlo, L., Light elements in the Earth's core, Nature Reviews Earth & Environment, 2, 645-658, 2021. SciX. ↩↩
-
Lord, O.T., Walter, M.J., Dasgupta, R. et al., Melting in the Fe-C system to 70 GPa, Earth and Planetary Science Letters, 284, 157-167, 2009. SciX. ↩↩
-
Mashino, I., Miozzi, F., Hirose, K. et al., Melting experiments on the Fe-C binary system up to 255 GPa: Constraints on the carbon content in the Earth's core, Earth and Planetary Science Letters, 515, 135-144, 2019. SciX. ↩↩↩↩↩↩↩↩
-
Mori, Y., Ozawa, H., Hirose, K. et al., Melting experiments on Fe-Fe\(_3\)S system to 254 GPa, Earth and Planetary Science Letters, 464, 135-141, 2017. SciX. ↩↩↩↩↩↩
-
Nakajima, Y., Takahashi, E., Suzuki, T. et al., "Carbon in the core" revisited, Physics of the Earth and Planetary Interiors, 174, 202-211, 2009. SciX. ↩↩↩
-
Oka, K., Hirose, K., Tagawa, S. et al., Melting in the Fe-FeO system to 204 GPa: Implications for oxygen in Earth's core, American Mineralogist, 104, 1603-1607, 2019. SciX. ↩↩↩↩