Mesh refinement
What this page checks
This page checks the mesh that Aragog refines towards the surface and the core-mantle boundary (CMB) with mesh.surface_cell_thickness and mesh.cmb_cell_thickness (see Mesh refinement). By default the mesh is refined: the CMB cell is 3000 m and the top cell is as thick as on the uniform mesh. Validation here means that we build or run Aragog on a case where we know the right answer, or on a much finer mesh, and check that Aragog gives it. The cases check:
- that the end cells have the thickness that was set;
- how the results change as the top cell gets thinner;
- how a coarser CMB cell changes the core;
- how the default CMB cell compares with finer uniform meshes;
- that the uniform mesh (both fields 0) gives its stored results to the round-off of another platform.
If this part were wrong, every run would compute the surface and CMB heat flow over cells of the wrong size. The runs of the second and third case set mlt_bottom_slope = 1.0 and their CMB cell in each run; the default-mesh case runs the solid rheology at its default parameters, which also have mlt_bottom_slope = 1.0. Each case below says why the check exists, what it tests, how we know the right answer and why it matters, then shows a plot or says why it has none, and the test details.
The end cells have the thickness that was set
Why this check exists. The stretched grid comes from a root solve for the stretching parameters and, in mass-coordinate mode, a second root solve for each node radius. If either solve returns a wrong value, the end cells have the wrong thickness, the nodes cross, or the mantle no longer ends at the CMB and surface radii.
What it tests. The mantle of abe_solid.toml is 1000 km thick with 100 nodes, so the uniform cell is about 10.1 km in radius mode. The test builds the mesh with a 200 m top cell, a 50 m top cell, and a 200 m top cell together with a 2 km CMB cell, in radius mode and in mass-coordinate mode. For each mesh the node radii must increase, the first and last radius must equal those of the uniform mesh, and each set end cell must equal its target.
How we know the right answer. The targets are the values in the config: the test compares the width of each end cell with the number that was set.
Why it matters. The surface and CMB heat flow are computed over the end cells, so the end cells decide how well the solver resolves the boundary layers.
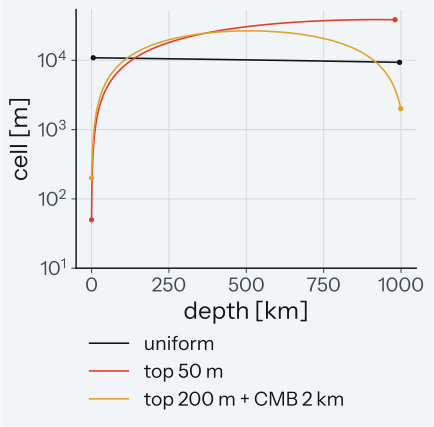
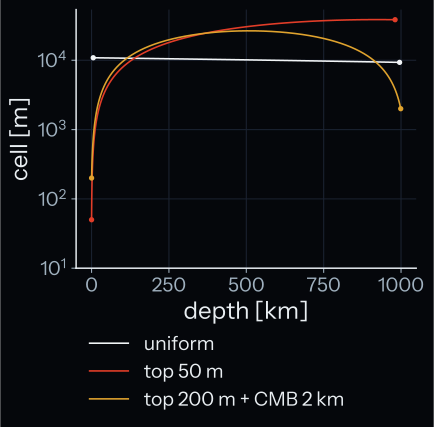
How to read the plot. The x-axis is the depth of each cell centre below the surface, in km; the y-axis is the cell thickness, in m, on a log scale. Each line is one mesh in mass-coordinate mode; the dots mark the two end cells, which the test asserts. The uniform mesh has cells from 9.3 to 10.9 km. With a 50 m top cell the cells grow with depth; the largest cell, 38.6 km, is the third cell above the CMB. With a 200 m top cell and a 2 km CMB cell the largest cell is 26.6 km, in the middle of the mantle.
Test details
- Reference: the end-cell thickness set in the config.
- Tolerance: \(10^{-6}\) relative in radius mode; in mass-coordinate mode 2 mm or \(10^{-6}\) relative, whichever is larger: the solved node of an end cell is placed to 1 mm, the other is the boundary itself.
- Test id:
tests/test_mesh_refinement_validation.py::test_the_refined_mesh_has_the_set_end_cells - Derivatives on the refined mesh, in
tests/test_mesh_refinement.py:- The end rows of the gradient are exact for a quadratic field. For a cubic field they give the truncation term of the stencil.
- The interior rows are exact at the midpoints of their two staggered nodes.
- The flux divergence has the second-order error \(2h^2/(3s)\) of a cell of width \(h\) at radius \(s\).
- The cooling half-space of the BC5 validation, with a top cell of a quarter of the uniform cell, follows its flux to 1 %. Its error is the error of the refined top cell.
- Command:
pytest tests/test_mesh_refinement_validation.py -m reference_pinned --validation-plots
How the results change as the top cell gets thinner
Why this check exists. The top cell sets how finely the solver resolves the cold layer at the surface. This case measures how much the results change when the top cell gets thinner.
What it tests. The case is the magma ocean of abe_solid.toml with a molten start (entropy 9466 J/kg/K), the stagnant-lid rheology and the PALEOS MgSiO\(_3\) tables with the low-temperature extension (paleos_lowt_spider_eos_1350x281). It runs to \(10^5\) years with top cells of 200, 100 and 50 m, at 100 and at 200 nodes. The CMB cell is held at the uniform CMB cell of each node count, rounded to the metre: 9327 m and 4638 m. The cells between the two ends change with the top cell: at 100 nodes the largest cell is 23.6, 25.8 and 28.0 km for a 200, 100 and 50 m top cell, against 10.9 km on the uniform mesh, and at 200 nodes it is 10.6, 11.7 and 12.8 km. A thinner top cell therefore also makes the cells in the deeper mantle coarser. The compared results are the global melt fraction at \(10^3\), \(10^4\) and \(10^5\) years, the heat lost through the surface up to \(10^5\) years, the mean surface heat flux in the windows \(10^2\) to \(10^3\), \(10^3\) to \(10^4\) and \(10^4\) to \(10^5\) years, and the CMB temperature at \(10^3\), \(10^4\) and \(10^5\) years: 10 results per node count.
How we know the right answer. There is no exact solution, so the test asks whether the results settle. For each result \(X\) it takes the spread between the 200 m and the 100 m run, \(s_\mathrm{c} = |X_{200}/X_{100} - 1|\), and between the 100 m and the 50 m run, \(s_\mathrm{f} = |X_{100}/X_{50} - 1|\). For an error that falls in proportion to the top cell, halving the cell halves the spread, so \(s_\mathrm{f}/s_\mathrm{c} = 0.5\). A result passes when \(s_\mathrm{f}/s_\mathrm{c} \le 0.75\) or when \(s_\mathrm{f} \le 3e\). The noise floor \(e\) comes from two more 50 m runs with the start entropy \(9466\,(1 \pm 10^{-12})\) J/kg/K: \(e = |X_+/X_- - 1|\), and no difference below \(3e\) is counted. It is the change of a result for a \(2 \times 10^{-12}\) change of the start entropy, measured with one pair of runs. A result with \(s_\mathrm{c} \le 3e\) counts as converged at 200 m only when \(s_\mathrm{f} \le 3e\) too; otherwise it does not pass. The rule does not ask whether the result changes in one direction. The two ratios nearest the threshold are 0.776 (the mean surface heat flux from \(10^4\) to \(10^5\) years at 100 nodes) and 0.790 (from \(10^2\) to \(10^3\) years at 200 nodes), so any threshold from 0.626, the largest ratio below 0.75, up to but not including 0.776 gives the same counts. With a fixed node count a thinner top cell also coarsens the deeper cells, so a pass shows that the result changes less from one top cell to the next, not that it approaches the solution of a finer mesh.
Why it matters. It shows how much a result of a run with a refined mesh depends on the choice of the top cell.
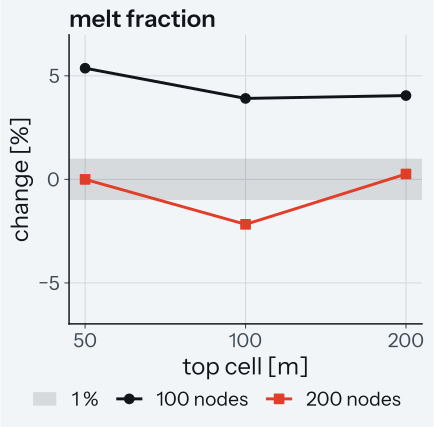
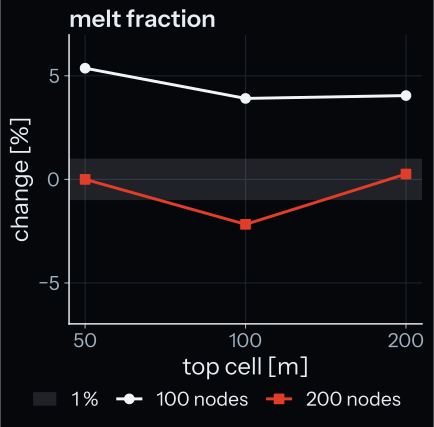
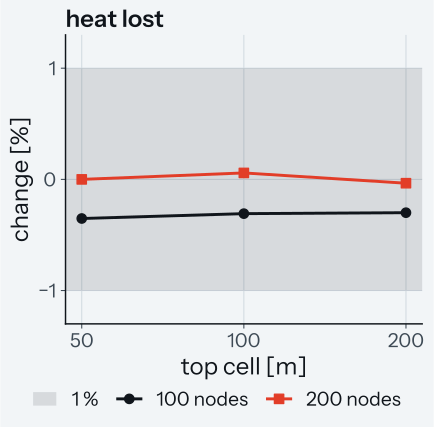
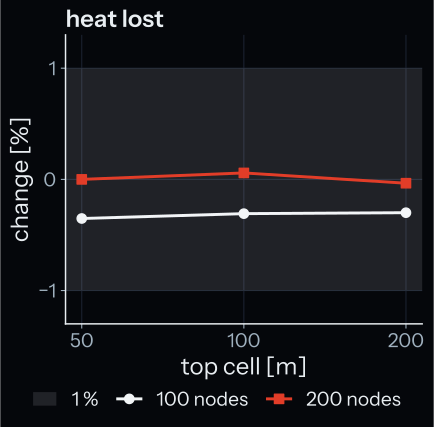
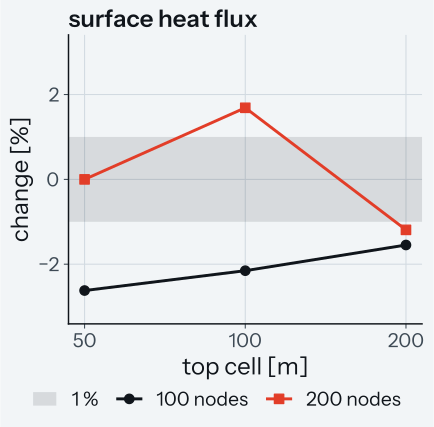
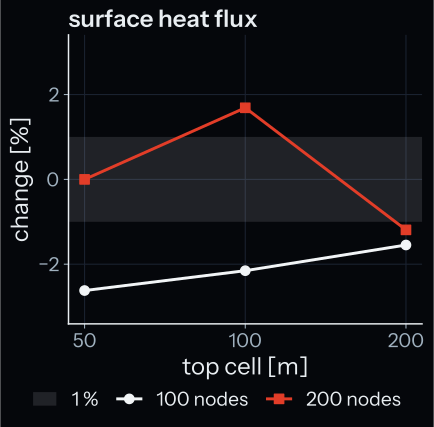
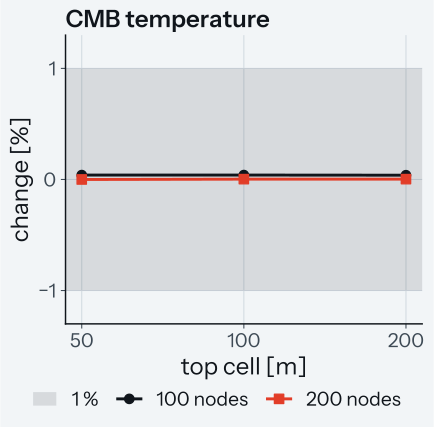
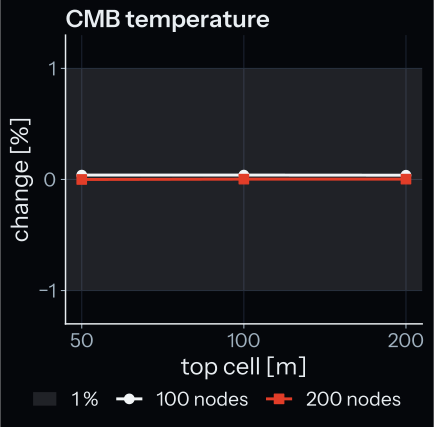
How to read the plots. Each plot shows one result as its change, in percent, from the 50 m run at 200 nodes, against the top cell thickness on a log axis: the global melt fraction at \(10^5\) years (top left), the heat lost up to \(10^5\) years (top right), the mean surface heat flux from \(10^4\) to \(10^5\) years (bottom left) and the CMB temperature at \(10^5\) years (bottom right). Circles are runs at 100 nodes, squares runs at 200 nodes. The grey band, marked 1 %, is \(\pm 1\) % around the 50 m run at 200 nodes; the noise floor \(3e\) of these four results is at most 0.04 % at 200 nodes and 0.17 % at 100 nodes, too narrow to draw. For a result that converges in the top cell, the squares move towards 0 from right to left; the circles keep the offset of the node count. The gap between the circles and the squares at the same top cell is the effect of the node count: for the melt fraction it is larger than the change between top cells.
What the study finds. At 200 nodes 5 of the 10 results pass: the melt fraction at \(10^3\) and \(10^4\) years, the CMB temperature at \(10^3\) years, the heat lost up to \(10^5\) years and the mean surface heat flux from \(10^4\) to \(10^5\) years. At 100 nodes 5 of the 10 pass. Of the 5 passes at 200 nodes, 4 do not change in one direction: the 100 m value does not lie between the 200 m and the 50 m value (3 of the 5 at 100 nodes). For these results the spread shrinks, but the study does not show that they approach a limit. The noise floor \(3e\) lies between \(7.4 \times 10^{-8}\) and \(1.4 \times 10^{-3}\) at 200 nodes. The CMB temperature of the 200 m and 100 m runs differs from the 50 m run by at most \(3.4 \times 10^{-5}\), but at 200 nodes its spreads do not shrink at \(10^4\) and \(10^5\) years.
- 50 m is the thinnest top cell tested. For each result at 200 nodes the test takes the largest top cell that stays within \(\max(3e, 1\,\%)\) of the 50 m run, together with every thinner top cell. The melt fraction at all three times and the mean surface heat flux after \(10^3\) years need 50 m: with a 100 m top cell the melt fraction at \(10^5\) years differs by 2.2 % and the mean surface heat flux from \(10^4\) to \(10^5\) years by 1.7 %. Each top cell is compared with the 50 m run, so the study does not show that the 50 m results are within 1 % of the converged values: the melt fraction at \(10^5\) years and the mean surface heat flux from \(10^3\) to \(10^4\) years do not pass the convergence rule at 200 nodes.
- The node count is not converged. At a 50 m top cell, going from 100 to 200 nodes changes the CMB temperature at \(10^5\) years by \(4.0 \times 10^{-4}\), the heat lost up to \(10^5\) years by \(3.5 \times 10^{-3}\) and the melt fraction at \(10^5\) years by 5.1 %. These changes are larger than the change from a 100 m to a 50 m top cell for the same results (\(3.2 \times 10^{-5}\), \(5.8 \times 10^{-4}\) and 2.2 % at 200 nodes). The mean surface heat flux from \(10^4\) to \(10^5\) years changes by 2.7 % with the node count and by 1.7 % with the top cell. On the uniform mesh the step from 200 to 400 nodes changes the melt fraction at \(10^3\) years by 7.6 % and the mean surface heat flux from \(10^3\) to \(10^4\) years by 3.6 %, against 0.21 % and 3.4 % for the step from 100 to 200 nodes, so 200 nodes are not converged in the node count either.
- The top cell freezes and melts many times. In every run without the core module the top cell freezes for the first time between 768 and 791 years. Up to \(10^5\) years it falls to the solidus at least 61 times in the 50 m run at 100 nodes and at least 72 times at 200 nodes, counted on the stored output rows. A melt fraction or a heat loss at one time can therefore depend on where in this sequence the time falls. The time mean of the melt fraction, taken from the first stored output at or after \(t/2\) (at most \(0.525\,t\)) to \(t\), is a diagnostic and not part of the pass rule: at 200 nodes it passes at \(10^3\) and \(10^4\) years and not at \(10^5\) years.
- The first frozen interval shortens as the top cell gets thinner. It lasts 85, 68 and 64 years for a 200, 100 and 50 m top cell at 100 nodes, and 79, 58 and 51 years at 200 nodes; it passes the convergence rule at both node counts. With a 50 m top cell it changes from 64 to 51 years between 100 and 200 nodes. On the uniform mesh, with a top cell of 10.9 km at 100 nodes, it lasts 2851, 513 and 255 years at 100, 200 and 400 nodes.
- Cost. Up to \(10^5\) years the solver takes \(2.4 \times 10^5\) steps on the uniform 100-node mesh, \(1.4 \times 10^6\) with a 200 m top cell and \(1.9 \times 10^6\) with a 50 m top cell, both at 100 nodes.
The long run. A 50 m top cell at 100 nodes runs to \(10^8\) years. Its first \(10^5\) years equal the 50 m run above. The global melt fraction is 0.065 at \(10^6\) years, \(3.3 \times 10^{-5}\) at \(10^7\) years and \(2.1 \times 10^{-5}\) at \(10^8\) years, and the mean surface heat flux falls from 163 W/m\(^2\) (\(10^5\) to \(10^6\) years) to 0.096 W/m\(^2\) (\(10^7\) to \(10^8\) years). The CMB temperature is 3465.0 K at \(10^6\) years and 3440.3 K at \(10^7\) and \(10^8\) years.
Why the CMB temperature stops at 3440.3 K.
- Why it happens. At the CMB pressure, 43.38 GPa, the last valid entropy node is 3070.70 J/kg/K, below the solidus entropy of the lowest cell. At the next node, 3150.82 J/kg/K, which is not valid, the table repeats the temperature of the last valid node: 3439.49 K and 3443.24 K at the two pressure nodes around the CMB pressure.
- What it is. Both nodes give the same temperature, so between the last valid node and the next node the table gives 3440.3 K at the CMB pressure. The CMB temperature at \(10^7\) and \(10^8\) years equals this value to \(10^{-12}\) relative, so the entropy at the CMB lies at or above the last valid node at both times. The entropy of the lowest cell, 3111.09 J/kg/K at \(10^7\) years and 3110.24 J/kg/K at \(10^8\) years, lies between the two nodes and still falls while the CMB temperature stays constant.
- Why it matters. After \(10^7\) years the CMB temperature of this run no longer changes with the entropy at the CMB.
The uniform mesh in the long run. The uniform 100-node mesh (top cell 10.9 km) also runs to \(10^8\) years with the same settings. Its first \(10^5\) years equal the uniform run above. The two meshes differ in every cell, not only in the top cell. At \(10^7\) and \(10^8\) years the lowest cell of the 50 m run lies between the last valid node and the next one of the solid table, and the lowest cell of the uniform run lies above the next node; in the decade from \(10^7\) to \(10^8\) years the heat through the CMB of the uniform run is 85 times that of the 50 m run. At \(10^7\) and \(10^8\) years its melt fraction is more than \(10^3\) times that of the 50 m mesh:
| Result | Mesh | \(10^6\) years | \(10^7\) years | \(10^8\) years |
|---|---|---|---|---|
| Global melt fraction | uniform | 0.12 | 0.12 | 0.079 |
| 50 m top cell | 0.065 | \(3.3 \times 10^{-5}\) | \(2.1 \times 10^{-5}\) | |
| CMB temperature [K] | uniform | 3495.6 | 3493.1 | 3463.3 |
| 50 m top cell | 3465.0 | 3440.3 | 3440.3 | |
| Mean surface heat flux [W/m\(^2\)] | uniform | 55 | 0.61 | 0.71 |
| 50 m top cell | 163 | 8.0 | 0.096 |
The mean surface heat flux is the mean over the decade that ends at the given time.
An alternating pattern on the 50 m mesh. On the 50 m mesh the difference between the entropy and the solidus entropy changes sign from one cell to the next. In the lowest 48 cells it changes sign 0 times at \(10^6\) years, 39 times at \(10^7\) years and 10 times at \(10^8\) years, out of 47 cell pairs. At \(10^7\) years 53 of the 99 cells lie within 5 J/kg/K of the solidus, and 38 at \(10^8\) years. The uniform mesh does not show the pattern, but it cannot test it: at the stored part ends up to \(10^8\) years none of its cells comes closer than 144 J/kg/K to the solidus. The cause of the pattern is not known.
Two more runs to \(10^8\) years test the pattern. The first repeats the 50 m run at 100 nodes from an initial entropy changed by \(10^{-12}\) (relative). It shows the same pattern: in the lowest 48 cells the sign changes 37 times at \(10^7\) years and 10 times at \(10^8\) years. The sign of the difference is the same as in the 50 m run at \(10^7\) and \(10^8\) years in 46 and 48 of these 48 cells. The second has a 50 m top cell at 200 nodes; its parts up to \(10^5\) years equal the stored 200-node run bit for bit. It shows the pattern on its own cells: in the 102 cells that span the radii of the lowest 48 cells at 100 nodes, the sign changes 36 times at \(10^7\) years and 12 times at \(10^8\) years, out of 101 cell pairs. At \(10^7\) years 116 of its 199 cells lie within 5 J/kg/K of the solidus, and 82 at \(10^8\) years. A change of \(10^{-12}\) in the initial state does not remove the pattern. On the finer mesh it alternates between neighbouring cells of that mesh.
Limits of the tables. The PALEOS liquid table in use agrees with the MgSiO\(_3\) liquid table of the PALEOS release on Zenodo (10.5281/zenodo.19680050) at 1 bar. On all 122 valid melt nodes at 1 bar, from 1831 K to 4862 K, the density differs by at most \(3.4 \times 10^{-5}\) (relative) and the entropy by at most 0.34 J/kg/K, with the Zenodo values interpolated linearly in temperature. That release has a known density step on the liquid branch, in which the entropy falls as the temperature rises (PALEOS issue 7). At 1 bar the step lies between 1595 K and 1620 K, where the density rises from 2227 to 3863 kg/m\(^3\), below the lowest valid melt node.
The solid table near the solidus. The entropy nodes of the solid temperature table are 80.1 J/kg/K apart. At 1301 of its 1350 pressure nodes the solidus entropy lies above the last valid node: at 853 of them below the next node, and at 448 between the next node and the one after.
In a run, a cell counts when its solidus entropy lies above the lower of the last valid nodes at the two pressure nodes around its pressure. This holds for 93 of the 99 cells of the 50 m meshes at 100 nodes, 185 of the 199 cells of the 50 m mesh at 200 nodes and 86 of the 99 cells of the uniform 100-node mesh, and for the top cell of every run. The count says where the table has no valid entry up to the solidus; the study does not measure what this changes in the results. It uses the tables as they are and was not repeated with other tables.
Not checked.
- How much the phase of the cycle changes the mean surface heat flux from \(10^4\) to \(10^5\) years and the heat lost up to \(10^5\) years.
- How much the noise floor varies between several perturbed copies; each floor here comes from one pair of runs, or one run in the CMB case.
- How the cooling of the long run changes when the table has valid entries up to the solidus at the CMB.
- Whether the alternating pattern follows the cells where the solid table has no valid entry up to the solidus.
Test details
- Reference: the raw values of the study runs in
tests/validation/data/mesh_refinement_study.json, written bytools/verification/run_mesh_refinement_study.pyfrom the run folders; the test computes the noise floor, the spreads, the verdicts, the recommendation and every number above from them. - Runs: on a Linux cluster, with the aragog source recorded in the header of the JSON file, PALEOS table
temperature_solid.datmd5 18d6f9eb5ba654d58fe3fad30ce118f0. The stored records come from the run probe of the study. The commandpython tools/verification/run_mesh_refinement_case.py <run folder> --eos-dir <tables> --samples 1e2,1e3,1e4,1e5 --nodes <n> --surface-cell <top> --cmb-cell <cmb> --s-init <S>, with the values of a run in the JSON file and samples to \(10^8\) years for the long runs, gives the config hash of every stored run (tests/test_mesh_refinement_study_tool.py). For the run with a 200 m top cell at 100 nodes it gives the stored output of the first two parts bit for bit. Its records add the fieldscore_bcandcore_module_params. With--rows <file>the same command writes the melt fraction of every stored row, from which the study tool takes the time mean. The test checks the stored output and does not rerun the runs; it rebuilds the mesh of every run and compares its end cells with the run to \(10^{-9}\) relative and its staggered pressure with the pressure that the study tool rebuilt to the local pressure gradient times 0.1 m, 6 times the largest shift of a staggered node measured between Linux and macOS. - Tolerance: each quoted number to the digits it is quoted with.
- Tables: the solid table at the CMB pressure and the melt table at 1 bar, with their md5, and the 1 bar rows of
paleos_mgsio3_tables_pt_proteus_liquid.datfrom Zenodo 19680050 (md5 4b5c14255ca845880a2e940110861df1), in the header of the same file. - Test ids:
tests/test_mesh_refinement_study.py::test_the_results_change_as_the_top_cell_gets_thinnerandtests/test_mesh_refinement_study.py::test_the_long_run_and_the_tables - Command:
pytest tests/test_mesh_refinement_study.py -m reference_pinned --validation-plots
A coarsened CMB cell and the core
Why this check exists. The core module computes the heat flow out of the core over half the CMB cell, so the CMB cell changes the cooling of the core.
What it tests. Two runs with the core module, both at 100 nodes with a 50 m top cell, from the molten start of the convergence study up to \(10^5\) years. In one run the CMB cell is set to 9327 m, the CMB cell of the uniform 100-node mesh (9327.4 m) rounded to the metre. In the other the CMB cell is 0, so only the top cell is set. The refinement then coarsens the CMB cell to 38456 m. That run is stretched from the top only, so its other cells differ too: its largest cell is 38.6 km, against 28.0 km in the run with the 9327 m CMB cell. The case therefore compares two meshes, not the CMB cell alone. The compared results are the temperature of the core at \(10^2\), \(10^3\), \(10^4\) and \(10^5\) years, which the core module uses as the CMB temperature, and the heat that crosses the CMB in each of the four intervals that end at these times. The temperature of the lowest mantle node differs from it by up to 39 K at these times.
How we know the right answer. There is no exact solution, so the test asks whether the difference between the two runs is larger than the change from a \(10^{-12}\) change of the start entropy. A third run repeats the run with the 9327 m CMB cell from a start entropy that differs by \(10^{-12}\) relative; here the floor comes from this one run, not from a pair as in the convergence study. Its relative difference from that run is the noise floor \(e\) of each result, and a difference counts only when it is above \(3e\).
Why it matters. The core temperature and the CMB cell set the CMB heat flow of the core module. This heat flow cools the core.
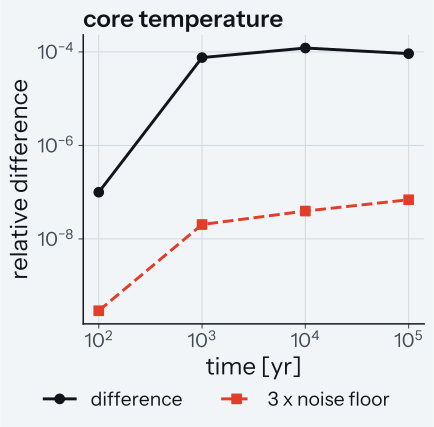
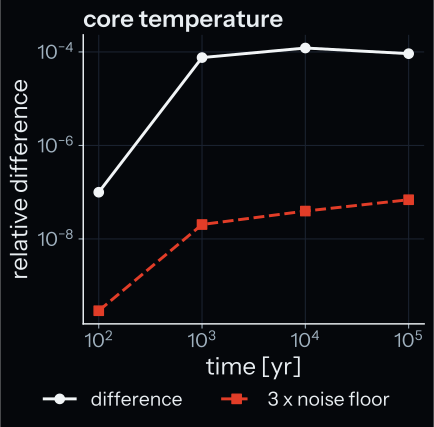
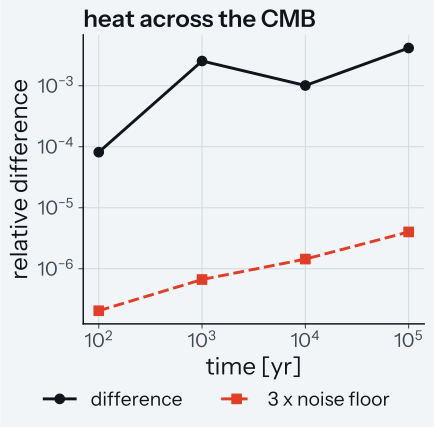
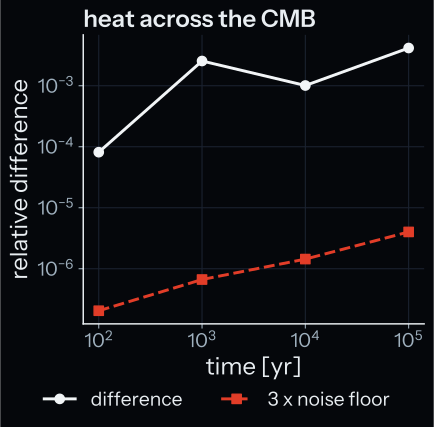
How to read the plots. The left plot shows the temperature of the core and the right plot the heat that crosses the CMB in each interval, against time on log axes. The circles are the relative difference between the runs with the 9327 m and the 38456 m CMB cell; the squares are the noise floor \(3e\). A circle above its square is a real difference.
What the study finds.
- All 8 differences are above \(3e\), by a factor of \(3.4 \times 10^2\) to \(3.8 \times 10^3\).
- With the 9327 m CMB cell the temperature of the core is lower at all four times, by at most 0.51 K (\(1.2 \times 10^{-4}\) relative) at \(10^4\) years.
- The heat that crosses the CMB changes by at most 0.42 %, in the interval from \(10^4\) to \(10^5\) years.
- Two runs give the size of the effect of the mesh at the CMB up to \(10^5\) years, at most \(1.2 \times 10^{-4}\) in the temperature of the core and 0.42 % in the CMB heat flow, but not which of the two meshes gives the right answer.
Not checked.
- A CMB cell thinner than the uniform cell: no run of this case has one; the next case has.
- Whether the CMB results of this case converge as the CMB cell gets thinner: a series of three or more CMB cells was not run.
- The CMB results after \(10^5\) years.
Test details
- Reference: the runs
C-cmb9327,C-offandC-on_pintests/validation/data/mesh_refinement_study.json; the test computes the differences, the noise floor and every number above from them. - Runs: on a Linux cluster, with the aragog source recorded in the header of the JSON file, made with the command of the convergence study plus
--core-module-params <file>holding the core module parameters stored with each run, core module on, PALEOS tabletemperature_solid.datmd5 18d6f9eb5ba654d58fe3fad30ce118f0. - Tolerance: each quoted number to the digits it is quoted with.
- Test id:
tests/test_mesh_refinement_study.py::test_a_coarsened_cmb_cell_changes_the_core_results - Command:
pytest tests/test_mesh_refinement_study.py -m reference_pinned --validation-plots
The default CMB cell against finer uniform meshes
Why this check exists. By default the mesh has a 3000 m cell at the CMB, and the CMB heat flux of the core module is taken across half of that cell. If the default mesh were too coarse, the core would cool at the wrong rate in every run that keeps the default.
What it tests. A solid mantle over a cooling core, from 0 to 100 Myr, on five meshes. The mantle is an Earth mantle in radius mode, from 3480 to 6371 km. It starts on one isentrope at 2045.05 J/kg/K with no melt in any cell, with the stagnant-lid rheology on at its default parameters (mlt_bottom_slope = 1.0, s_top_inf = 0.22, c_theta = 0.15), the mixing length nearest_boundary and radiogenic heating. The CMB boundary condition is the core module (core_bc = "core_module"). The core module starts at 2500 K. The tables are the PALEOS MgSiO\(_3\) tables with the low-temperature extension, built to 350 GPa. The meshes are the uniform mesh at 160, 320 and 640 nodes, with CMB cells of 18.18, 9.06 and 4.52 km (U160, U320, U640), and the default mesh at 80 and 160 nodes (D80, D160). In the default mesh the largest cell is 1.865 times the mean cell at 80 nodes and 1.621 times at 160 nodes. The compared results are the CMB heat flux \(q_\mathrm{cmb}\), the core temperature and the mantle temperature at mid radius, at 3, 50 and 100 Myr.
How we know the right answer. There is no exact solution, so the reference is the finest mesh, U640. The test computes each difference from U640. The runs use Aragog's CMB law, which takes the larger of the conductive and the convective flux. In every call of the five runs the conductive flux is the larger one. A second run of D80 gives the stored outputs bit for bit. The run at 80 nodes on the uniform mesh (U80) is left out of the comparison: there the convective flux is the larger one in 59 % of the calls, by at most 0.0025 W/m\(^2\), so its flux does not come from the conductive branch alone. The 0.0025 W/m\(^2\) is the largest excess in one call, not an effect summed over the run, so the study does not split the 0.034 W/m\(^2\) by which U80 lies below U640 at 50 Myr between the branch and its 36.6 km CMB cell.
Why it matters. The default mesh sets the core cooling of every run that does not set the mesh. The case covers runs like it: the core module, the NumPy right-hand side, radius mode, a solid start and the nearest_boundary mixing length. It does not cover the constant length that PROTEUS uses by default.
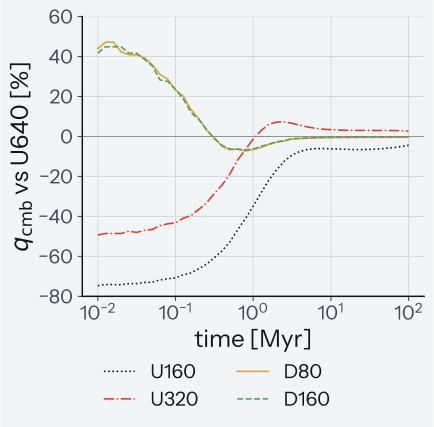
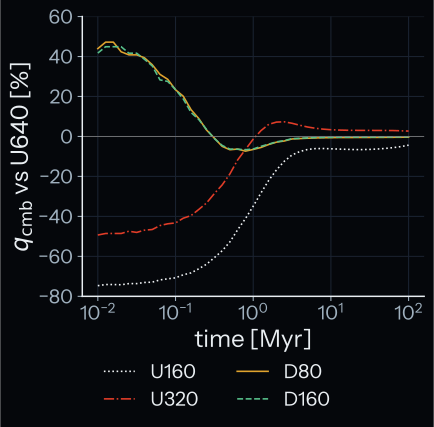
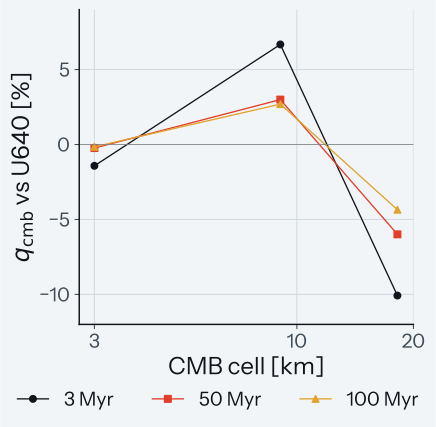
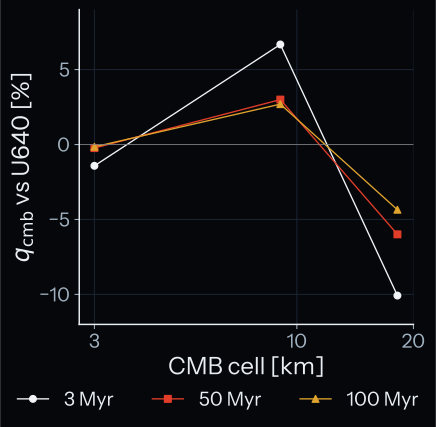
How to read the plots. The left plot shows \(q_\mathrm{cmb}\) of U160, U320, D80 and D160 relative to that of U640, in percent, against time on a log axis. The right plot shows the same relative flux at 3, 50 and 100 Myr against the CMB cell of D160, U320 and U160 (3, 9.06 and 18.18 km). A value at 0 matches U640.
What the study finds.
- After the start, the default mesh is within 0.45 % of U640: D80 is 0.45 % and 0.35 % below it at 50 and 100 Myr, D160 0.23 % and 0.15 %.
- At 3, 50 and 100 Myr the largest difference of the core temperature and of the mantle temperature at mid radius from those of U640 is 0.103 K for D80 and 0.044 K for D160.
- U80, left out of the comparison, has a flux 33.12 % and 30.54 % below that of U640 at 50 and 100 Myr, and a core 10.18 K hotter at 100 Myr.
- The uniform mesh converges slowly and not in one direction. At 3 Myr U160 is 10.08 % below U640 and U320 6.68 % above it; at 100 Myr U160 is 4.35 % below it and U320 2.69 % above it.
- The meshes differ most in the start transient (values on the stored time grid of 40 points per decade). At 0.01 Myr D80 is 44 % above U640 and D160 42 % above it. D80 reaches its lowest value, 7.9 % below U640, at 0.53 Myr, and from 28.2 Myr on it differs from U640 by less than 0.5 % (D160: from 7.5 Myr). At 3 Myr D80 is 1.60 % and D160 1.42 % below U640.
Known limit. U640 is not a converged reference. Its CMB cell, 4.52 km, is thicker than the 3 km cell of the default mesh. At 3 Myr the uniform series does not settle, so the differences of 1.42 to 1.60 % there do not show which mesh is closer to the right answer. At 50 and 100 Myr U320 still lies 3.00 % and 2.69 % above U640, more than D80 differs from U640, so the 0.45 % is the distance to U640, not an error bound.
Not checked.
- The noise floor of these runs: no run was repeated from a perturbed start.
- A molten mantle, a mantle in mass-coordinate mode, and other table sets.
- The other core boundary conditions (PROTEUS runs
energy_balanceby default) and the JAX right-hand side. - The CMB cell of other meshes: which branch of the CMB law gives the flux depends on the CMB cell (on the uniform 80-node mesh the convective flux is the larger one in 59 % of the calls).
- The results after 100 Myr.
Test details
- Reference: the stored values of the 5 runs in
tests/validation/data/core_mesh_study.json, written bytools/verification/run_core_mesh_study.py; the test computes every number above from them. The 5 runs and a second run of D80 use the tool of this repository; the second run of D80 gave the stored outputs bit for bit. - Runs:
python tools/verification/run_core_mesh_case.py tools/verification/data/core_mesh_study.toml <out> --eos-dir <tables> --solid-s0 2045.05 --t-core 2500 --nodes <n> --cmb-cell <m> --surface-cell <m or uniform>, with a first segment of 2000 yr and then 2000 segments of 50 000 yr. The aragog source of the stored runs and of the rerun of D80 is in the header of the JSON file, with the md5 of the outputs of both. The tables are built by Zalmoxis (generate_spider_eos_tables) from the PALEOS MgSiO\(_3\) solid, liquid and low-temperature solid tables, at 350 GPa with 1350 by 280 points; the md5 of the source tables and of every built table file are in the same header. - Tolerance: each quoted number to the digits it is quoted with.
- Test ids:
tests/test_core_mesh_study.py::test_the_stored_runs_and_their_meshandtests/test_core_mesh_study.py::test_the_default_cmb_cell_against_finer_uniform_meshes - Command:
pytest tests/test_core_mesh_study.py -m reference_pinned --validation-plots
Without refinement the results are unchanged
Why this check exists. The refinement code sits in the mesh constructor that every run uses. A change to the path without refinement, for example a refined branch that runs when both fields are 0, would change every run on the uniform mesh without notice.
What it tests. With both fields at 0, the test builds the abe_solid.toml mesh in mass-coordinate and in radius mode, evaluates the right-hand side once and solves for 100 years with the NumPy right-hand side and with the JAX right-hand side. The mesh arrays and the right-hand side must equal those of the stored reference to \(10^{-10}\) and the end states to \(10^{-6}\), relative to each value or to the largest value of the array. The arrays are not compared exactly because the reference comes from macOS and the round-off of Linux differs. The mesh arrays and the right-hand side have the tight tolerance; the end-state comparison is a coarse check. In radius mode a refined branch run with both fields at 0 gives the uniform mesh to round-off, which no tolerance that covers the round-off of another platform can tell apart. So a unit test checks that the mesh with both fields at 0 does not call the refined grid, its radii check or, in radius mode, the cell-mass density, and that it solves every mass-coordinate radius to 1 m. The test also requires that the JAX solve called the JAX right-hand side, in the stored reference and in the test.
How we know the right answer. The reference is the same set of arrays on the uniform mesh, stored by tools/verification/generate_mesh_refinement_off_reference.py at the commit named in the file.
Why it matters. A run with both fields at 0 gets the uniform mesh and must give the stored results of the uniform mesh. The default mesh is refined (a 3000 m CMB cell, the top cell of the uniform mesh), so this case covers the runs that set the uniform mesh.
This case has no plot: it checks that two sets of arrays are equal, which a plot cannot show.
Test details
- Reference:
tests/reference/mesh_refinement_off_reference.npz, the arrays of the uniform mesh, with the commit, the platform and the JAX call count that wrote them. - Tolerance: mesh arrays and right-hand side \(10^{-10}\); end states \(10^{-6}\).
- Test id:
tests/test_mesh_refinement_off_reference.py::test_the_refinement_off_path_equals_the_stored_reference - Command:
pytest tests/test_mesh_refinement_off_reference.py