Tabulated core
What this page checks
This page checks the core on the PALEOS liquid iron isentrope, profile_source = "paleos" (explanation). Validation here means that a test runs the code on a case with a known right answer and checks that the code gives it, within a stated tolerance. The answers are an analytical limit, a published budget, an independent integral of the same table, a slope comparison, energy conservation and a published ab initio value. A wrong isentrope or a wrong heat capacity changes how fast the core cools, when its inner core starts to grow and how much heat crosses the core-mantle boundary (CMB) into the mantle. Each case says why the check exists, what it tests, how we know the right answer and why it matters, then shows its plot and ends with a box "Test details".
The cores are the Zalmoxis core arrays of planets of 1, 3 and 5 Earth masses (\(M_E\)), in tests/validation/data/ with their provenance. The 1 and 3 \(M_E\) cores are liquid. The 5 \(M_E\) structure has a solid core, since no liquid one was available; the cases take only its pressures. The table is the PALEOS liquid iron table on 40 points per decade of pressure, cut to 45 GPa to 3 TPa and 1996 to 20,000 K. The Gaussian budget, which several cases compare with, is the budget of the default core profile, profile_source = "gaussian": a closed-form density with a constant \(\alpha\) and \(c_p\) (core module).
A table of constant properties gives the Gaussian budget
Why this check exists. A wrong factor in the secular heat capacity, a wrong slope of the isentrope or a wrong onset root would give a budget that differs from the Gaussian budget of the same core.
What it tests. The test builds a table whose thermal expansivity \(\alpha\) and heat capacity \(c_p\) are constant (1.35e-5 K\(^{-1}\), 840 J kg\(^{-1}\) K\(^{-1}\)), from the Gaussian Earth structure. On 801 nodes it compares the secular, latent and gravitational capacities, the inner-core radius \(r_\text{icb}\) and the onset temperature with the Gaussian budget, from 3000 to 6000 K.
How we know the right answer. For constant \(\alpha\) and \(c_p\) the isentrope is \(T_\text{cmb}\exp(-\alpha\psi/c_p)\), with \(\psi\) the gravitational potential: the adiabat of the Gaussian profile (analytical).
Why it matters. The PALEOS path then reduces to the path it replaces when the material is simple.
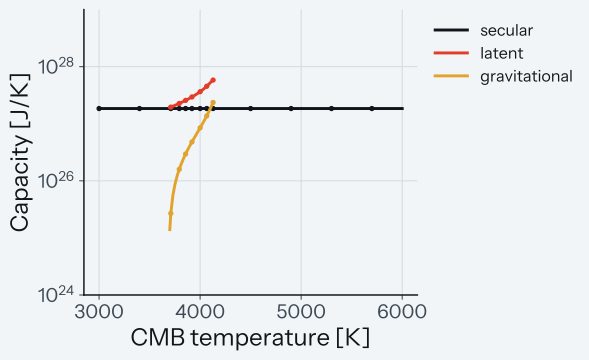
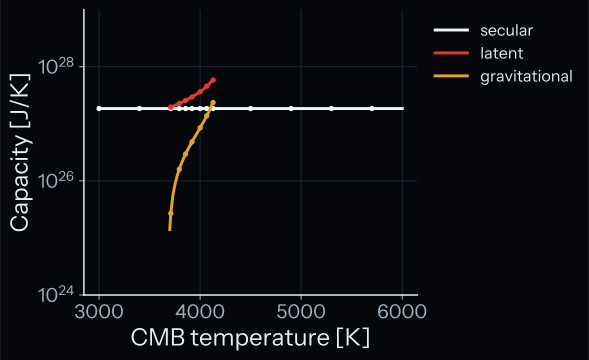
How to read the plot. The plot shows each capacity against the CMB temperature: lines are the Gaussian budget, markers the tabulated one. The latent and gravitational terms exist only while an inner core grows, between freeze-out and onset. The markers lie on the lines; the differences are below the tolerance of \(10^{-6}\) and too small to draw. The measured differences are in the box below.
Test details
- Reference: the Gaussian adiabat \(T_\text{cmb}\exp(-\alpha\psi/c_p)\) (analytical).
- Tolerance: relative \(10^{-6}\) on every term, \(r_\text{icb}\) and the onset temperature.
- Measured: on an Apple M1 Ultra the largest relative differences are 6.5e-10 for the secular capacity, 3.0e-7 for the latent, 5.1e-7 for the gravitational, 5.3e-8 for \(r_\text{icb}\) and 2.0e-9 for the onset temperature. The latent and gravitational differences change in their fifth digit on another CPU, since they pass through the root of \(r_\text{icb}\).
- Test id:
tests/test_core_budget_tabulated.py::test_a_constant_property_table_gives_the_gaussian_budget(unit tier) - Command:
pytest -o "addopts=" tests/test_core_budget_tabulated.py -k constant_property
The Earth budget of Nimmo (2015) on the PALEOS isentrope
Why this check exists. A speed of the inner-core boundary taken from a wrong isentrope slope would change \(Q_L\), \(Q_g\) and the growth rate, and a latent heat per unit mass other than the 750 kJ kg\(^{-1}\) of the input would change \(Q_L\). The case also shows how much each term moves from the published Earth budget.
What it tests. The core has the structure, melting curve, latent heat (750 kJ kg\(^{-1}\)) and density jump of Nimmo (2015)3 (ch. 8.02, Table 2), as in the Gaussian case. Only the temperature profile changes, to the PALEOS liquid isentrope with \(c_p\) = 840 J kg\(^{-1}\) K\(^{-1}\), on 801 nodes of the same structure. At a CMB heat flow of 15.2 TW the test computes the secular, latent and gravitational heat flows \(Q_s\), \(Q_L\) and \(Q_g\), the cooling rate of the CMB and the growth rate of the inner core.
How we know the right answer. Table 4 of the same chapter gives the terms on the Gaussian adiabat; the Gaussian path of Aragog meets them to 2 %. On the PALEOS isentrope the terms have no published value, because the isentrope moves the inner core. The test holds 2 parts to a tight tolerance, because they do not depend on where the inner core is:
- \(Q_L/Q_g\) must equal its Gaussian value to \(10^{-6}\): both terms scale with the speed of the inner-core boundary on one structure.
- The latent heat per unit mass must stay 750 kJ kg\(^{-1}\), to \(10^{-12}\).
\(Q_L/Q_g\) cannot see a wrong speed of the boundary, since both terms take it from the same function. A second test pins that speed, \(|dr_\text{icb}/dT_\text{cmb}|\), to a centred difference (0.01 K) of the boundary found from the table entropy alone: to \(10^{-5}\) at 3835, 3850 and 3865 K, measured at most 6.2e-7. An isentrope slope 1 % off in radius moves the speed by 4.3e-3 to 1.9e-2 and fails it.
For the other PALEOS terms the test holds only the direction of the change from Table 4, with wide bounds.
Why it matters. The PALEOS isentrope is steeper than the Earth adiabat of the chapter. This changes when an inner core forms and how fast it grows, which sets the heat that drives a dynamo.
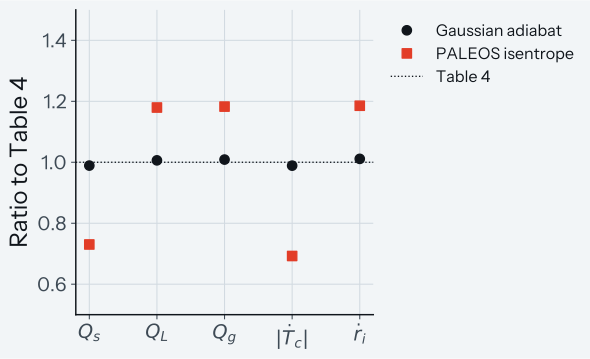
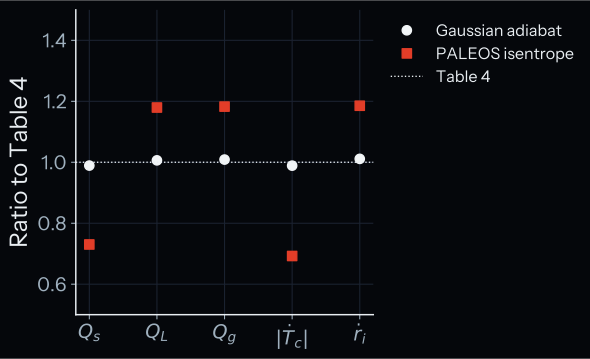
How to read the plot. Each mark is a term divided by its value in Table 4; the dotted line at 1 is the table. Circles are the Gaussian adiabat, squares the PALEOS isentrope, both at a 1220 km inner core. \(|\dot T_c|\) is the cooling rate of the CMB and \(\dot r_i\) the growth rate of the inner core. The test holds the circles within 2 % of the line, too close to draw; it holds the squares only to wide bounds (above 1.1 for \(Q_L\), \(Q_g\) and \(\dot r_i\), below 0.8 for \(Q_s\) and \(|\dot T_c|\)).
Known limit. Table 4 is at a CMB temperature of 4180 K, but there the PALEOS isentrope has no inner core. So the terms are compared at the 1220 km inner core of Table 2:
- At 4180 K the PALEOS centre is at 6278 K, above the melting point there, 5808 K.
- The inner core appears below 3874 K on the PALEOS isentrope, against 4239 K on the Gaussian adiabat.
- Both paths freeze out at 3818 K, where the CMB reaches the melting curve. So the whole inner core grows over 56 K of cooling on the PALEOS isentrope, against 421 K on the Gaussian adiabat.
- The 1220 km inner core is at 3835 K on the PALEOS isentrope, 17 K above freeze-out.
- There the speed of the boundary per kelvin of cooling, \(|dr_\text{icb}/dT_\text{cmb}|\), is 1.67 times that on the Gaussian adiabat, and the latent and gravitational heat per kelvin rise with it.
- So the CMB cools at 0.69 of the table rate. \(Q_L\), \(Q_g\) and the growth rate end at 1.18 times the table, \(Q_s\) at 0.73.
Test details
- Reference: Nimmo (2015)3, ch. 8.02, Table 2 (inputs) and Table 4 (terms at 15.2 TW).
- Tolerance: \(Q_L/Q_g\) against the Gaussian value, relative \(10^{-6}\) (measured 1.6722 on both paths); latent heat 750 kJ kg\(^{-1}\), relative \(10^{-12}\); Gaussian path 2 % on \(Q_s\), \(Q_L\), \(Q_g\) and the cooling rate. PALEOS path: no inner core at 4180 K, the PALEOS onset below 4180 K and the Gaussian onset above it, \(|dr_\text{icb}/dT_\text{cmb}|\) between 1.5 and 1.8 times the Gaussian value, \(Q_L\), \(Q_g\) and the growth rate above 1.1 and \(Q_s\) and the cooling rate below 0.8 times Table 4. Boundary speed against the centred difference of the table root: relative \(10^{-5}\) (measured at most 6.2e-7).
- Test id:
tests/test_core_tabulated_nimmo.py::test_the_nimmo_earth_budget_on_the_paleos_isentrope,::test_the_boundary_sensitivity_is_the_slope_of_the_table_root(unit tier) - Command:
pytest -o "addopts=" tests/test_core_tabulated_nimmo.py
The isentrope equals the integral of the adiabatic gradient
Why this check exists. An error in the inversion of the table entropy, or in the interpolation between CMB temperatures, would put the core at the wrong temperature.
What it tests. On the 1, 3 and 5 \(M_E\) cores the test integrates \(d\ln T/d\ln P = \nabla_\text{ad}\) from the CMB inward with the adiabatic gradient \(\nabla_\text{ad}\) of the same table. It starts 500 K and 2000 K above the pure-iron melting point at the CMB and compares the temperature with the isentrope that the budget reads.
How we know the right answer. Along an isentrope, \(d\ln T/d\ln P = \nabla_\text{ad}\) by definition; the table holds \(s\) and \(\nabla_\text{ad}\) as separate columns, so the 2 routes are independent.
Why it matters. The temperature of the isentrope sets the heat capacity and where the inner core starts to grow.
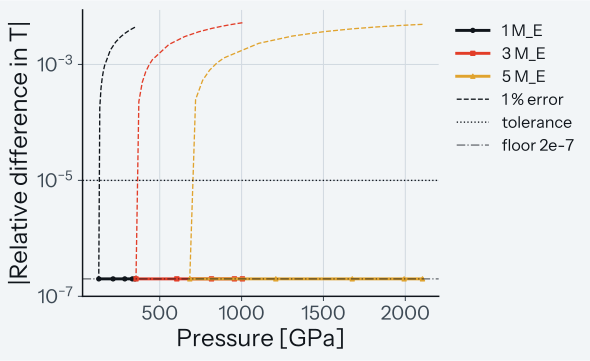
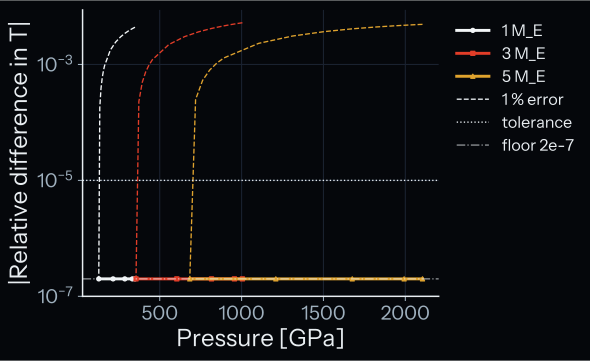
How to read the plot. Each solid line with markers is one core, from its CMB pressure to its centre pressure. The test runs 2 starting temperatures for each core; at each pressure the line shows the larger of their 2 differences. A difference below 2e-7 is drawn on the dash-dotted floor at 2e-7, because its last digits change from one CPU to another; all 3 cores lie on the floor. The dashed lines are the same comparison with \(\nabla_\text{ad}\) 1 % too large; they rise from round-off at the CMB to their largest value at the centre. The dotted line is the tolerance, a relative \(10^{-5}\). The solid lines lie below it and the dashed lines above it, so the test separates the isentrope from one with a 1 % error.
Test details
- Reference: the integral of \(\nabla_\text{ad}\) of the same table (independent column).
- Tolerance: relative \(10^{-5}\) in \(T\). A 1 % error in \(\nabla_\text{ad}\) moves the centre by more than \(10^{-3}\).
- Measured: largest difference 1.1e-7; with \(\nabla_\text{ad}\) 1 % too large, 4.3e-3 to 5.3e-3 at the centre.
- Test id:
tests/test_core_tabulated_validation.py::test_the_isentrope_equals_the_integral_of_nabla_ad(unit tier) - Command:
pytest -o "addopts=" tests/test_core_tabulated_validation.py -k nabla_ad
A pure iron core freezes from the centre
Why this check exists. If the melting curve were less steep than the isentrope, the core would freeze from the top, a case the budget does not model.
What it tests. At every node of the 3 cores the test compares the slope of the pure-iron melting curve, \(dT_m/dP\), with the slope of the liquid isentrope at the melting point, \(\nabla_\text{ad}T_m/P\). The margin is their ratio minus 1.
How we know the right answer. The melting curve is that of Anzellini et al. (2013)1, which PALEOS also uses. González-Cataldo & Militzer (2023)2 find from ab initio simulations that the melting line of iron is steeper than its adiabats, so cores freeze from the centre.
Why it matters. The budget books latent and gravitational heat only for an inner core that grows from the centre.
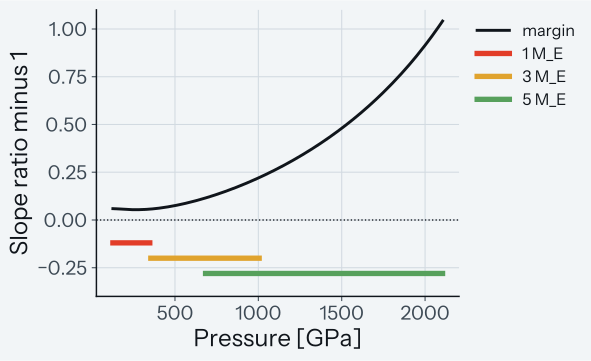
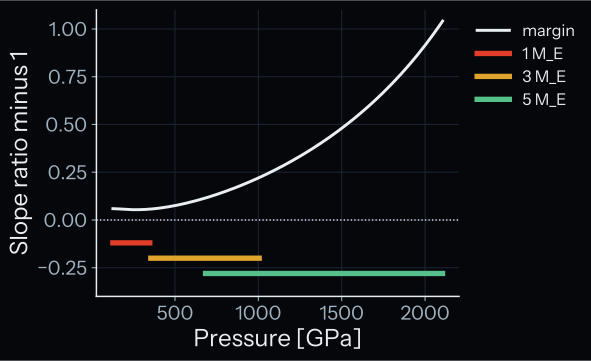
How to read the plot. The line is the margin against pressure; a positive margin means freezing from the centre. The bars below show the pressure range of each core. The dotted line is zero. The test asserts a margin above 0.05 at every node of each core; the smallest margin is 0.054.
Known limit. The margin is read on the liquid table at the melting point, for pure iron only. A melting curve lowered by light elements has another slope, which this case does not check.
Test details
- Reference: Anzellini et al. (2013)1; the slope comparison of González-Cataldo & Militzer (2023)2, p. 9.
- Tolerance: margin above 0.05 at every node; measured smallest 0.054. A melting slope 6 % smaller fails on the 1 and 3 \(M_E\) cores.
- Test id:
tests/test_core_tabulated_validation.py::test_a_pure_iron_core_freezes_from_the_centre(unit tier) - Command:
pytest -o "addopts=" tests/test_core_tabulated_validation.py -k freezes
The core ledger of each solver call
Why this check exists. A heat change booked from another function than the one the solver integrates would let the core gain or lose heat that no flux carries.
What it tests. The core has the Gaussian Earth structure on 201 nodes and the PALEOS liquid isentrope. It starts at the temperature of a molten mantle base and runs 5 calls, from 0 to 122 yr. Each call runs at the default tolerances and at tolerances 1000 times tighter. A second test runs a call across the onset of the inner core. The residual of a call is (core heat change plus CMB heat) divided by the CMB heat.
How we know the right answer. Energy conservation: the heat the core loses equals the heat that crosses the CMB. A residual that comes from the solver tolerance falls when the tolerance falls. A residual that comes from booking the heat change from the wrong function does not. The rule is that of the Gaussian path.
Why it matters. The core ledger is part of the energy check of every coupled run.
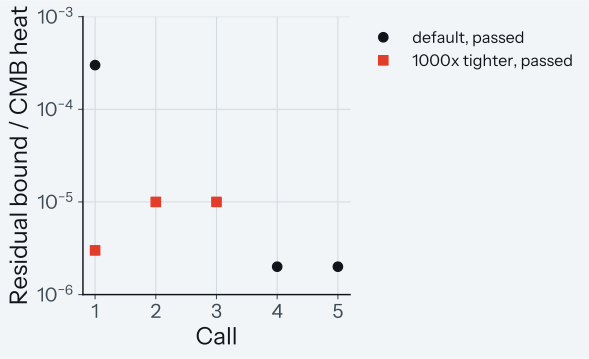
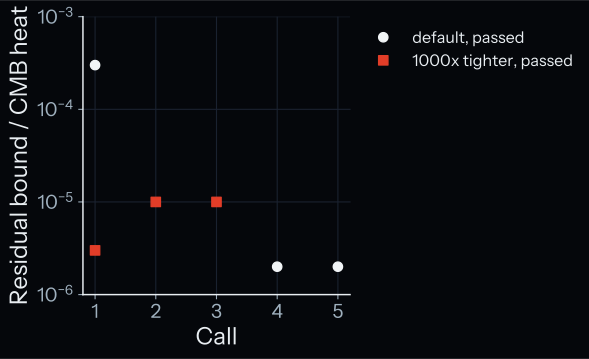
How to read the plot. The horizontal axis is the call number, 1 to 5; the vertical axis is the bound on the absolute residual divided by the CMB heat, on a log scale. A circle is the bound at the default tolerances, a square the bound at the 1000 times tighter ones; each mark is drawn only when the test passes it. Calls 2 and 3 have no fixed bound at the default tolerances and calls 4 and 5 none at the tight ones. There the test asks that the residual falls at least 20 times; in calls 1 to 3 each residual also stays below twice the tolerance scale of the solver. The plot shows the bounds and not the residuals, because the residuals change with the CPU: the smallest residual at the default tolerances is 1.39e-7 on an Apple M1 Ultra and 1.03e-7 on the Linux x86 runner of the nightly tests.
The residuals on an Apple M1 Ultra (macOS), at the default tolerances (rtol and atol \(10^{-8}\)) and at tolerances 1000 times tighter:
| Call | Time [yr] | Default tolerances | 1000 times tighter | Ratio |
|---|---|---|---|---|
| 1 | 0 to 1 | -1.28e-4 | -1.18e-6 | 108 |
| 2 | 1 to 2 | -3.09e-5 | -2.57e-7 | 120 |
| 3 | 2 to 12 | -4.44e-6 | -3.21e-8 | 138 |
| 4 | 12 to 22 | -1.39e-7 | -2.16e-9 | 64 |
| 5 | 22 to 122 | 1.30e-6 | 1.09e-8 | 120 |
Known limit. The checks cover single calls and calls in a chain, on a fixed structure. A run of billions of years with structure updates is not checked here; it needs the coupling to PROTEUS.
Test details
- Reference: energy conservation; the rule of the Gaussian path.
- Tolerance:
- call 1: between \(10^{-5}\) and 3e-4 at the default tolerances, below 3e-6 at the tight ones;
- calls 1 to 3 and the onset call: fall at least 20 times, to below \(10^{-5}\); at each tolerance the residual is below twice the tolerance scale
step_core_tol_J, that scale is less than 1000 times the residual, and it also falls at least 20 times; - calls 4 and 5: below 2e-6 at the default tolerances, and fall at least 20 times.
- Measured: the table above, with SUNDIALS 7.7.0 (scikits-odes-sundials 3.1.1), NumPy 2.4.6, SciPy 1.17.1, OpenBLAS 0.3.33 and JAX 0.9.2. With SUNDIALS 7.2.1, NumPy 2.4.3, SciPy 1.16.0 and OpenBLAS 0.3.30 on the same CPU, call 3 gives -3.36e-8 at the tight tolerances (ratio 132) and call 4 gives -1.41e-7 at the default ones (ratio 65); the other values agree to 3 digits. In both builds call 1 is -1.3e-4 and -1.2e-6, calls 1 to 3 fall more than 100 times, and calls 4 and 5 are -1.4e-7 and 1.3e-6.
- Test id:
tests/test_core_tabulated_ledger.py::test_the_tabulated_core_ledger_converges_with_the_tolerance,::test_a_tabulated_call_across_the_onset_converges_with_the_tolerance(smoke tier) - Command:
pytest -o "addopts=" tests/test_core_tabulated_ledger.py
The entropy of fusion
Why this check exists. The latent heat of the inner core is the entropy of fusion times the temperature at its boundary. The test fails if the default of ds_fusion changes, or if the conversion from \(k_B\) per atom to J kg\(^{-1}\) K\(^{-1}\) uses a wrong atomic mass or constant. It also shows how far the constant lies from an ab initio value.
What it tests. The constant 172.8 J kg\(^{-1}\) K\(^{-1}\) of ds_fusion against 1.05 \(k_B\) per atom at 300 GPa, with \(k_B\) the Boltzmann constant, converted to 156.3 J kg\(^{-1}\) K\(^{-1}\) for iron.
How we know the right answer. González-Cataldo & Militzer (2023)2, p. 9, give 1.05 \(k_B\) per atom at 300 GPa, falling to 0.8 \(k_B\) per atom at 1000 GPa.
Why it matters. The latent heat sets how fast the inner core grows for a given heat flow.
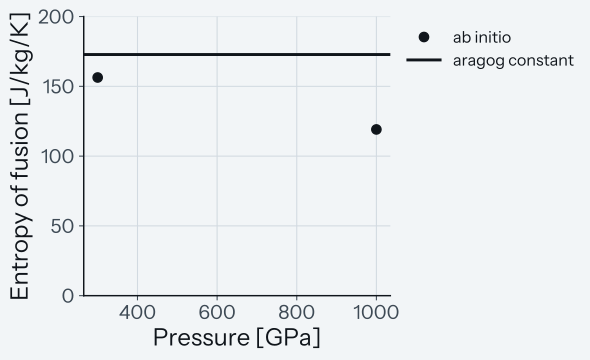
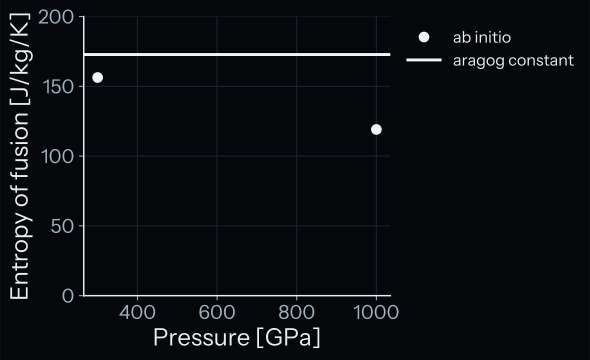
How to read the plot. The line is the constant of the code; the 2 points are the ab initio values at 300 and 1000 GPa. The constant lies 10.5 % above the value at 300 GPa.
Known limit. The code uses one constant at all pressures. At 1000 GPa the ab initio value is 0.8 \(k_B\) per atom, and the constant is 1.45 times that value.
Test details
- Reference: González-Cataldo & Militzer (2023)2, p. 9.
- Tolerance: the ratio 1.105 is pinned to an absolute 5e-4 and the converted ab initio value, 156.3 J kg\(^{-1}\) K\(^{-1}\), to an absolute 0.05. No bound applies to the agreement of the constant with the ab initio value.
- Test id:
tests/test_core_tabulated_validation.py::test_the_entropy_of_fusion_against_the_ab_initio_value(unit tier) - Command:
pytest -o "addopts=" tests/test_core_tabulated_validation.py -k fusion
-
S. Anzellini, A. Dewaele, M. Mezouar, P. Loubeyre, G. Morard, Melting of Iron at Earth's Inner Core Boundary Based on Fast X-ray Diffraction, Science, 340, 464-466, 2013. SciX. ↩↩
-
F. González-Cataldo, B. Militzer, Ab initio determination of iron melting at terapascal pressures and Super-Earths core crystallization, Physical Review Research, 5, 033194, 2023. SciX. ↩↩↩↩
-
F. Nimmo, Energetics of the Core, in G. Schubert (ed.), Treatise on Geophysics, 2nd edition, Elsevier, 8, ch. 8.02, 27-55, 2015. ↩↩