Validation of spectral files
This page tests the Generation III PROTEUS spectral files in three ways: whether they reproduce the radiation limit of a runaway greenhouse atmosphere, how much the outgoing longwave radiation (OLR) changes with the number of bands, and how they compare with a line-by-line calculation. It covers Snowline, Breezehome and Volenfell.
The calculations were made with AGNI version 1.14.0, which calls SOCRATES for the radiative transfer. They use the two-stream solver with equivalent extinction for overlapping gases, include continuum absorption, and leave out Rayleigh scattering, clouds and stellar radiation. The temperature profiles are prescribed rather than solved for, as described in each section. The scripts that make these calculations and figures are in misc/validation/spectral_files in the AGNI repository.
Runaway greenhouse
A pure-steam atmosphere above a water ocean has an upper limit on its OLR (Komabayasi 1967; Ingersoll 1969). As the surface warms, the atmosphere becomes optically thick, and its emission comes from the upper part of the atmosphere, where the temperature follows the saturation curve of H2O. The OLR then stays almost constant as the surface warms further: this is the radiation limit of the runaway greenhouse (Kasting 1988; Nakajima et al. 1992). Once the surface is hot enough (above about 1700 K in these calculations), the hot lower atmosphere emits at shorter wavelengths, where H2O absorbs less, and the OLR rises again (e.g. Goldblatt et al. 2013; Hamano et al. 2015).
Set-up. The atmosphere is pure H2O with an inventory of 270 bar. Below the critical temperature, the surface pressure is the saturation vapour pressure if that is smaller than 270 bar, with the rest of the water taken to be in the ocean. The temperature follows a dry adiabat from the surface, replaced by the saturation curve wherever the adiabat would be supersaturated, up to 10−5 bar on 100 levels. The gas is ideal with constant heat capacity, and the gravity is 9.81 m s−2. The surface temperature runs from 200 K to 2500 K in steps of 25 K. The set-up follows the canonical runaway notebook in AGNI.
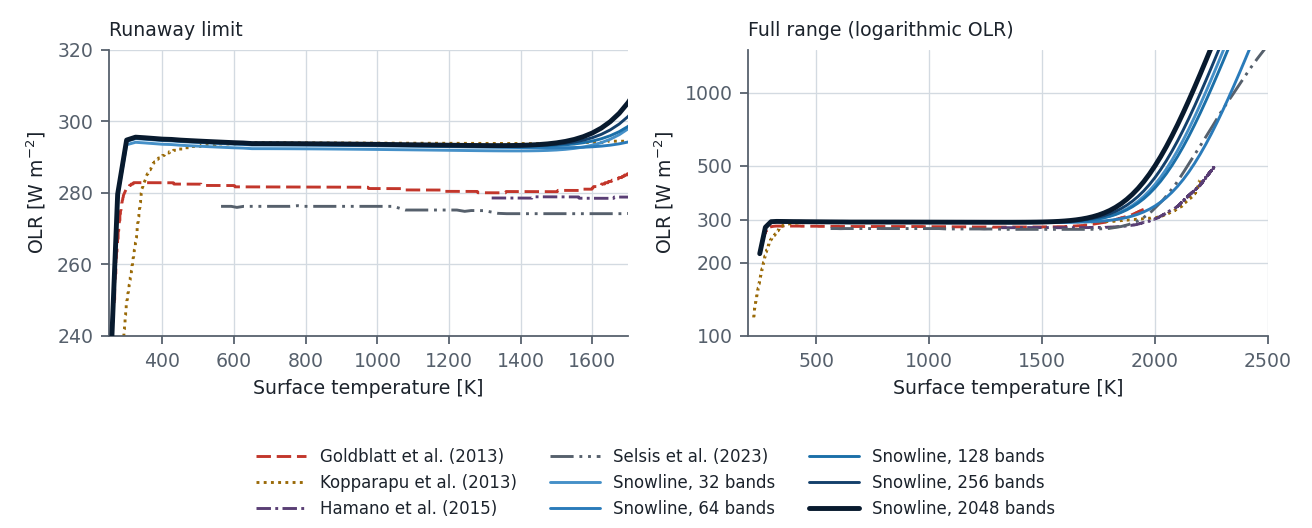
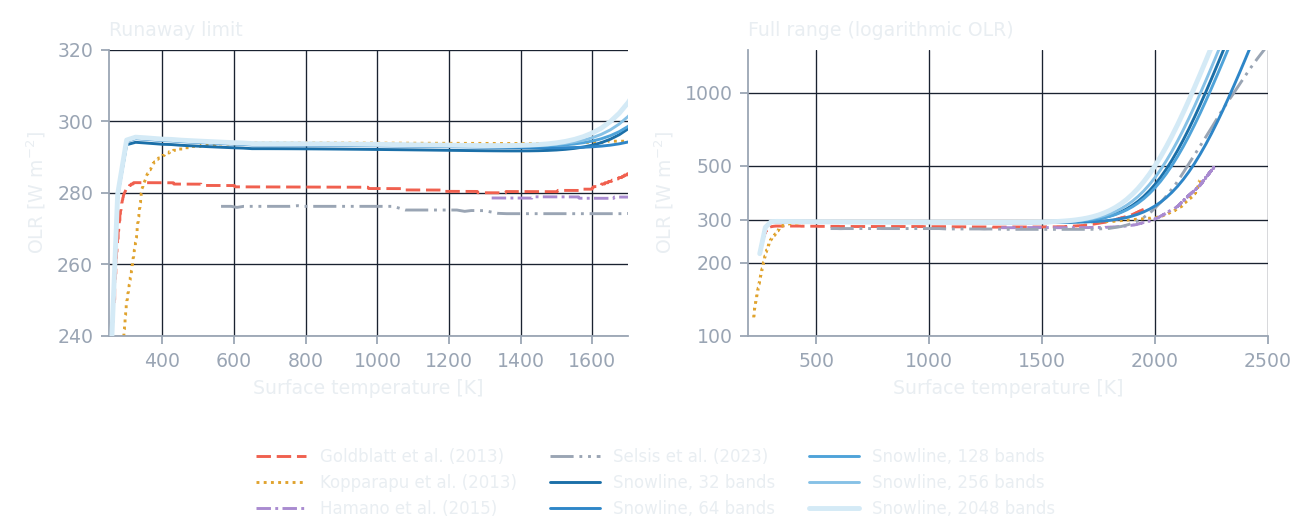
OLR in W m−2 at selected surface temperatures:
| Source | 400 K | 1000 K | 1500 K | 2000 K | 2200 K |
|---|---|---|---|---|---|
| Snowline, 32 bands | 294 | 292 | 292 | 419 | 891 |
| Snowline, 64 bands | 295 | 293 | 293 | 342 | 558 |
| Snowline, 128 bands | 295 | 293 | 293 | 406 | 822 |
| Snowline, 256 bands | 295 | 294 | 294 | 448 | 990 |
| Snowline, 2048 bands | 295 | 294 | 294 | 500 | 1190 |
| Goldblatt et al. (2013) | 283 | 281 | 280 | ||
| Kopparapu et al. (2013) | 290 | 294 | 294 | 306 | |
| Hamano et al. (2015) | 279 | 303 | 417 | ||
| Selsis et al. (2023) | 276 | 274 | 336 | 604 |
- Snowline gives a runaway limit of 292–296 W m−2 for surface temperatures between 300 K and 1500 K, at every band count. Breezehome has the same bands and H2O data as Snowline, and gives the same OLR.
- This agrees with Kopparapu et al. (2013) to within 2 %, and is 4–7 % higher than Goldblatt et al. (2013), Hamano et al. (2015) and Selsis et al. (2023). These models differ from each other and from this set-up in their opacity data and assumptions, so exact agreement is not expected.
- Above about 1700 K the OLR depends strongly on the number of bands, and does not change monotonically with it. At 2200 K it ranges from 558 W m−2 with 64 bands to 1190 W m−2 with 2048 bands. At this temperature every band count except 64 gives a higher OLR than Hamano et al. (2015) and Selsis et al. (2023).
The Goldblatt et al. (2013), Kopparapu et al. (2013) and Hamano et al. (2015) curves were digitised from Fig. 12a of Hamano et al. (2015), and the Selsis et al. (2023) curve from their Fig. 2 (convective profiles). The data are in res/literature_data/runaway in the AGNI repository.
Number of bands
Each Generation III family is available with 32, 64, 128, 256 and 2048 bands. Here the OLR from the files with fewer bands is compared with the 2048-band file of the same family, which resolves the spectrum most finely. No line-by-line calculation was made, so this shows how consistent the band counts are with each other, not how accurate the 2048-band files are.
Set-up. The temperature follows a dry adiabat from the surface up to an isothermal stratosphere at one third of the surface temperature (one half for Volenfell), up to 10−5 bar on 40 levels. The composition is fixed and the same at all heights. The compositions are illustrative, not the result of a chemistry calculation:
| Family | Composition (mole fractions) | Surface pressures | Surface temperatures |
|---|---|---|---|
| Snowline | H2O | 1 and 100 bar | 700, 1500 and 2500 K |
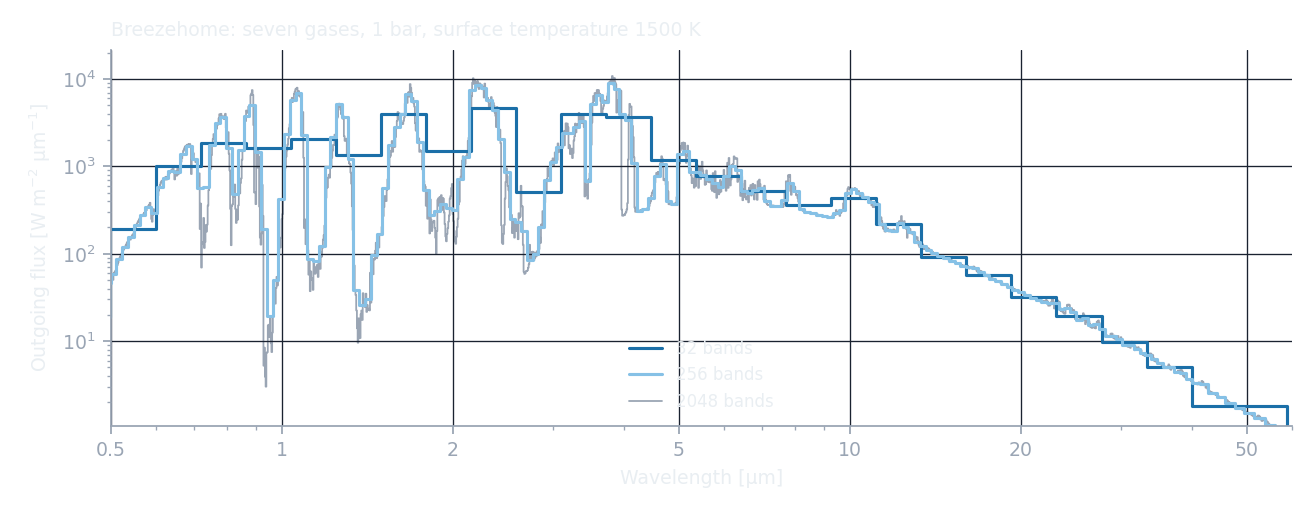
| Breezehome | H2O 0.5, CO2 0.3, CO 0.05, O2 0.05, SO2 0.05, OCS 0.03, S2 0.02 | 1 and 100 bar | 700, 1500 and 2500 K |
| Volenfell | O2 0.30, Na 0.30, SiO 0.20, Fe 0.10, MgO 0.05, K 0.03, CO 0.0195, TiO 0.0005 | 0.1 and 10 bar | 2000, 3000 and 4000 K |
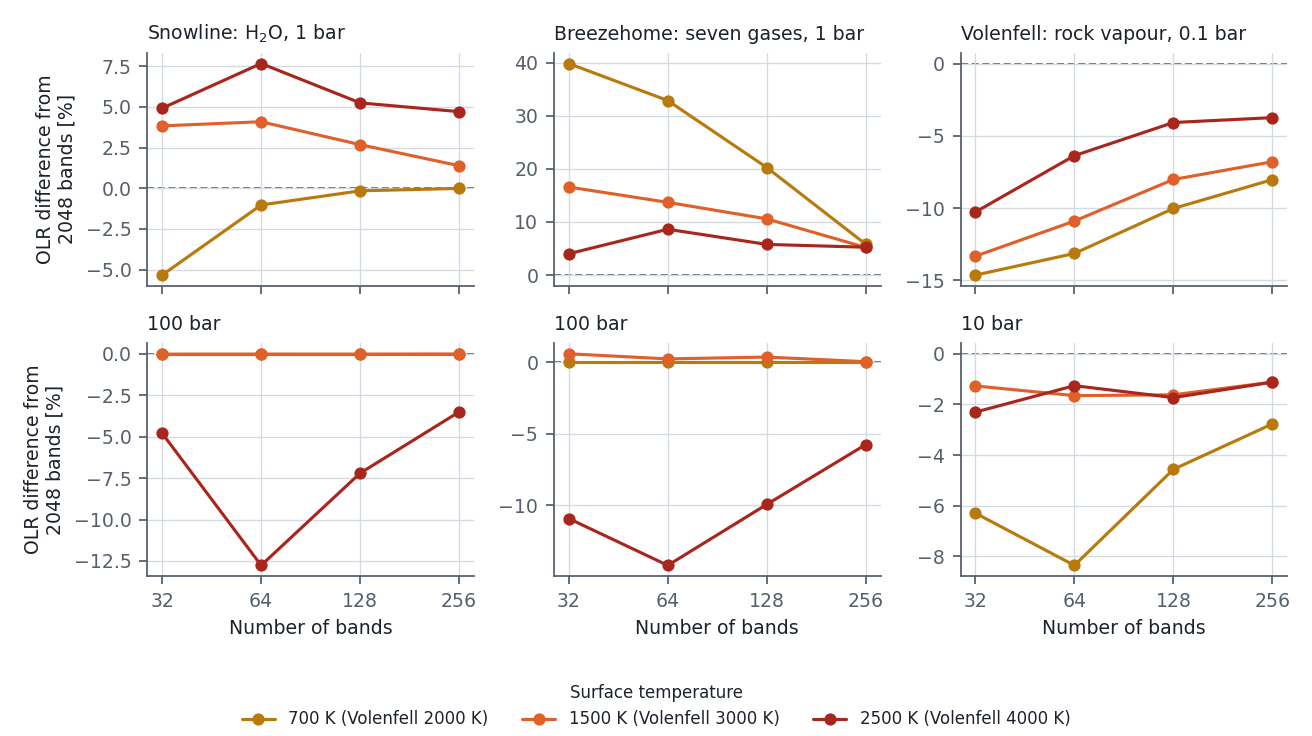
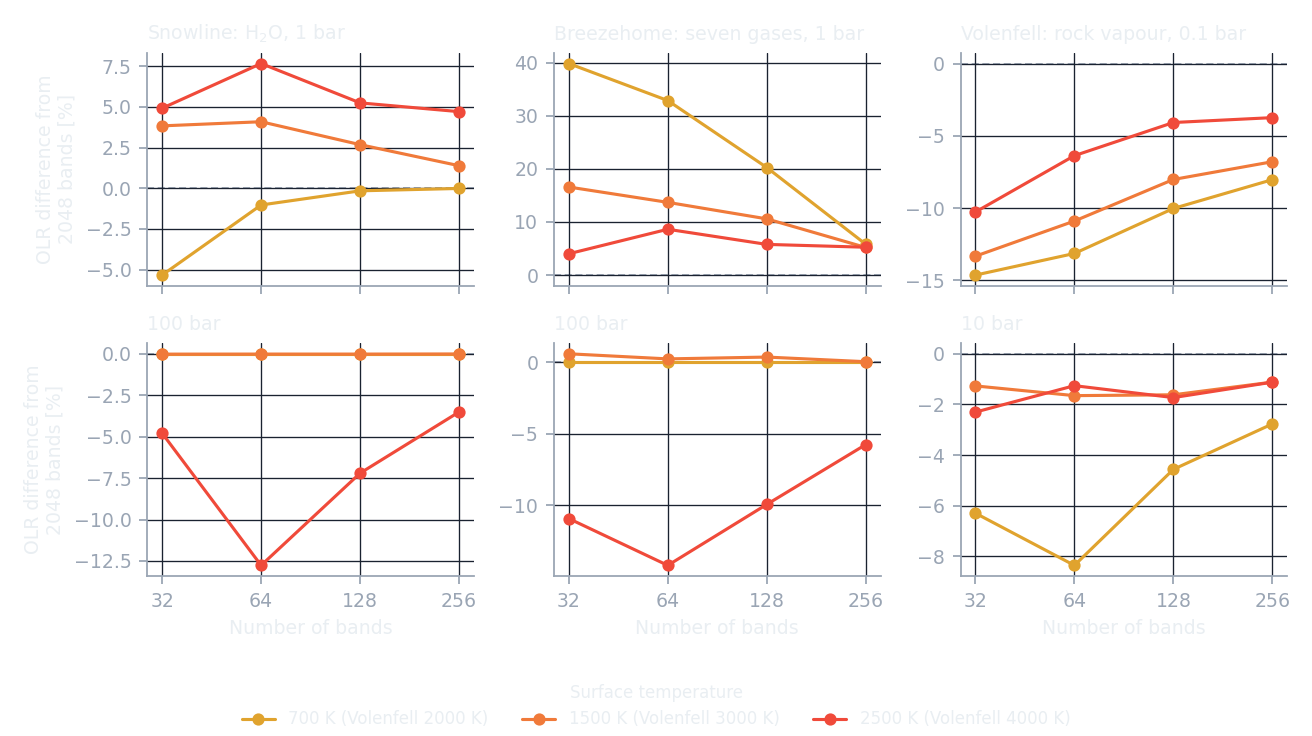
- At 100 bar with surface temperatures of 700 K and 1500 K, every band count agrees with the 2048-band file to within 0.6 %. These atmospheres are optically thick, and the OLR is set by the isothermal stratosphere.
- In the other cases, the files with fewer bands differ more. With 32 bands, the OLR is 40 % higher for Breezehome at 1 bar and 700 K, and 15 % lower for Volenfell at 0.1 bar and 2000 K.
- With 256 bands, the OLR is within 5 % of the 2048-band file for Snowline, within 6 % for Breezehome and within 8 % for Volenfell, in every case.
- The differences do not always shrink as the number of bands grows. At 100 bar and 2500 K, the 64-band files of Snowline and Breezehome differ more (−13 % and −14 %) than the 32-band files (−5 % and −11 %).
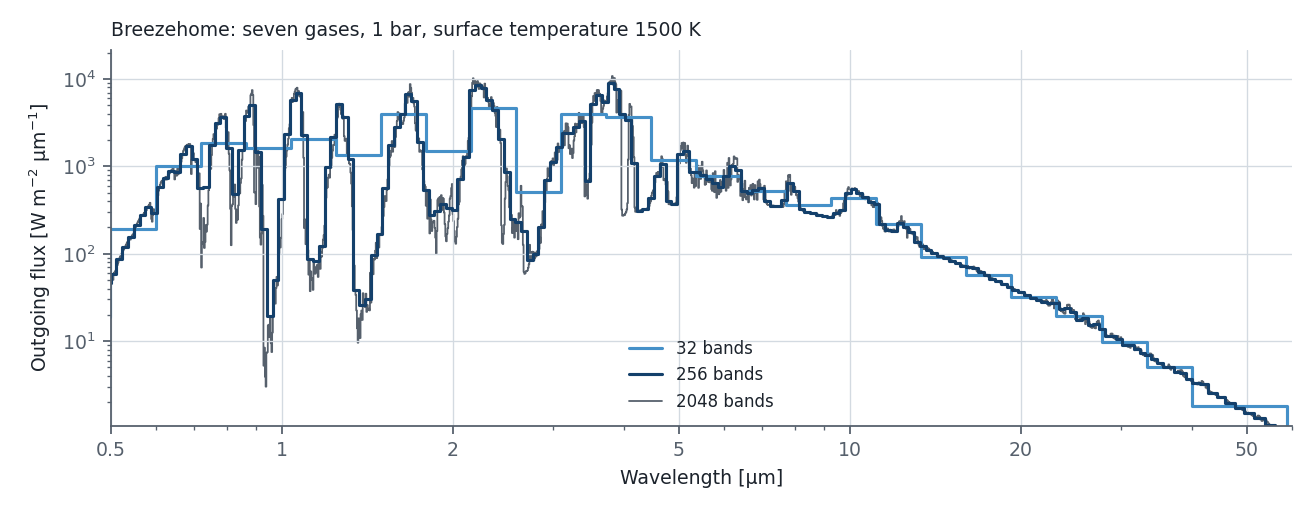
Line-by-line comparison
AGNI can also calculate the outgoing flux line by line with the Reference Forward Model (RFM; Dudhia 2017). Here the RFM is run on the same atmosphere as Breezehome, using the HITRAN lines of H2O and CO2 between 4000 and 5000 cm−1 (2.0–2.5 µm) that AGNI downloads with get_data.sh parfiles (Zenodo record).
Set-up. The atmosphere is 70 % H2O and 30 % CO2 at 1 bar, with a surface temperature of 700 K, and the same type of profile as in Number of bands. Continua are left out of both calculations, so only line absorption is compared. The RFM radiance is calculated every 0.002 cm−1 at a secant of 1.66 and multiplied by π to give a flux; 1.66 is the diffusivity factor of the two-stream scheme that AGNI uses in the longwave. The RFM needs line data a little beyond each end of the range it calculates, so it covers 4026–4973 cm−1, and only the bands that lie within this range are compared. None of the 32-band file's bands do.
The two calculations do not use the same line data: Breezehome uses the ExoMol POKAZATEL (H2O) and Dozen (CO2) line lists, computed with PyExoCross, while the RFM uses HITRAN with its own line shapes and cut-off. The comparison therefore tests the line data and the k-term fits together.
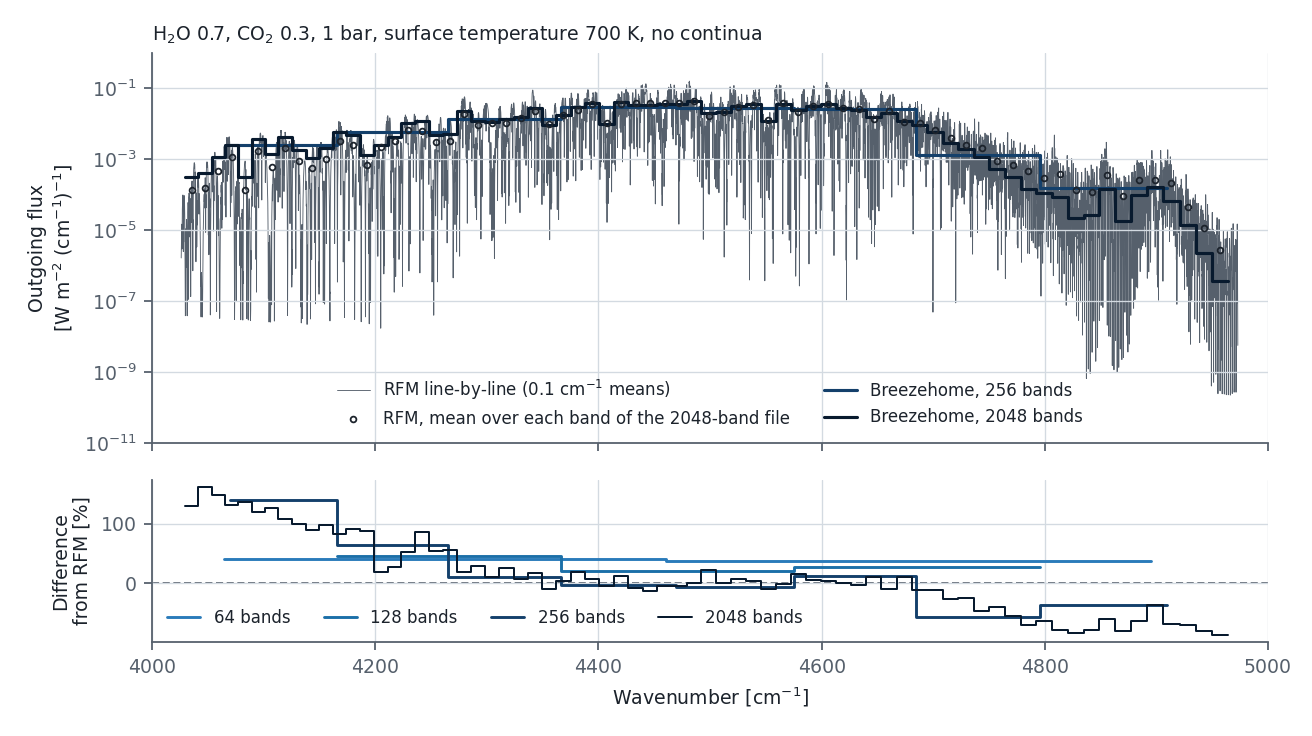
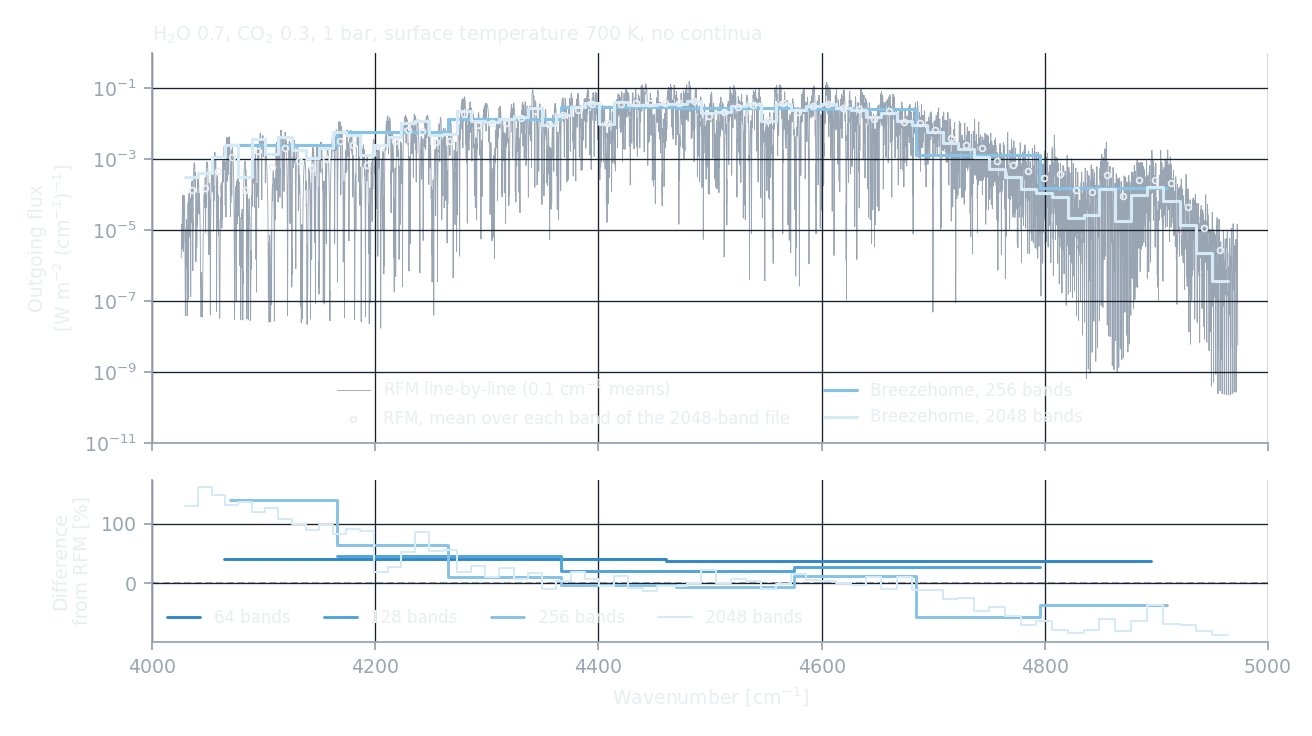
- Over the 71 bands of the 2048-band file that lie in this range, Breezehome gives 5.5 % more outgoing flux than the RFM (11.66 against 11.05 W m−2). With 256 bands (8 bands in the range) it gives 3.1 % more.
- Between 4300 and 4700 cm−1, which carries 89 % of the flux, the 2048-band file agrees with the RFM to within −13 % to +25 % in each band. Larger differences occur at both ends, where the band-mean flux falls to 1/330 (below 4300 cm−1) and 1/15 000 (above 4700 cm−1) of its peak: up to +160 % between 4026 and 4300 cm−1, and down to −87 % above 4700 cm−1. These bands carry 8 % and 2 % of the flux.
- The 64- and 128-band files give 38 % and 26 % more flux than the RFM over their bands, in line with the band-count comparison above, where fewer bands give a higher OLR for Breezehome at 1 bar and 700 K.
- The RFM band fluxes change by less than 0.4 % when its step is increased from 0.002 to 0.01 cm−1.
References
- Dudhia, A. 2017, Journal of Quantitative Spectroscopy and Radiative Transfer 186, 243, doi:10.1016/j.jqsrt.2016.06.018.
- Goldblatt, C., Robinson, T. D., Zahnle, K. J. & Crisp, D. 2013, Nature Geoscience 6, 661, doi:10.1038/ngeo1892.
- Hamano, K., Kawahara, H., Abe, Y., Onishi, M. & Hashimoto, G. L. 2015, ApJ 806, 216, doi:10.1088/0004-637X/806/2/216.
- Ingersoll, A. P. 1969, Journal of the Atmospheric Sciences 26, 1191, doi:10.1175/1520-0469(1969)026<1191:TRGAHO>2.0.CO;2.
- Kasting, J. F. 1988, Icarus 74, 472, doi:10.1016/0019-1035(88)90116-9.
- Komabayasi, M. 1967, Journal of the Meteorological Society of Japan 45, 137, doi:10.2151/jmsj1965.45.1_137.
- Kopparapu, R. K., et al. 2013, ApJ 765, 131, doi:10.1088/0004-637X/765/2/131.
- Nakajima, S., Hayashi, Y.-Y. & Abe, Y. 1992, Journal of the Atmospheric Sciences 49, 2256, doi:10.1175/1520-0469(1992)049<2256:ASOTGE>2.0.CO;2.
- Selsis, F., Leconte, J., Turbet, M., Chaverot, G. & Bolmont, É. 2023, Nature 620, 287, doi:10.1038/s41586-023-06258-3.