rhs.c: Entropy time-derivative assembly
Source under test: rhs.c
Cases
Reported dS/dt matches finite difference of outputs
Reference-pinned test: tests/test_rhs.py::test_reported_dsdt_matches_finite_difference_of_outputs
Reference: Analytical self-consistency: the reported dS/dt matches the finite-difference slope of consecutive outputs over 10-year macro steps.
Tolerance: rel 2e-2 at every staggered node (observed at most 0.65 percent, midpoint rule over 10 years).
Command: make, then pytest -o addopts= tests/test_rhs.py::test_reported_dsdt_matches_finite_difference_of_outputs (add --validation-plots to write the plot pair)
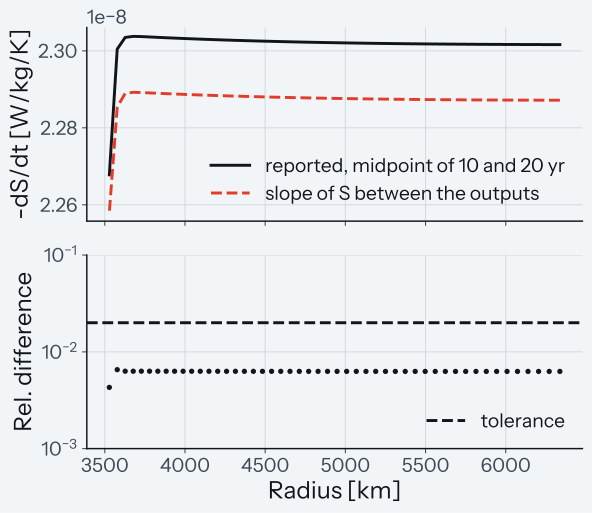
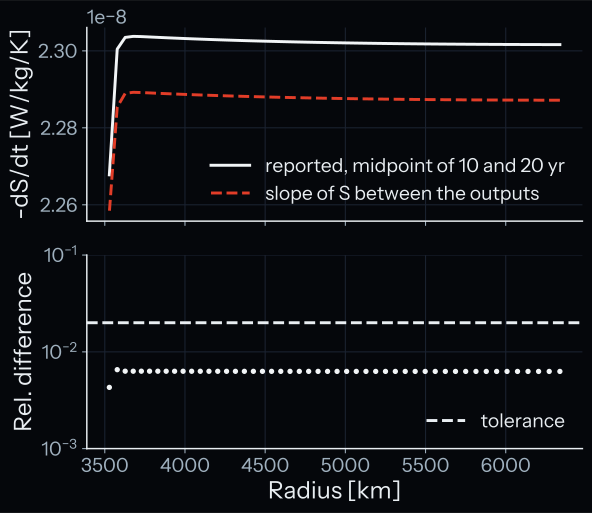
Top: the cooling rate -dS/dt that rhs.c reports, as the mean of the 10 and 20 yr outputs (line), and the slope of the entropy between these outputs (dashed), at every staggered node of the blackbody50 run. Bottom: their relative difference per node (dots) and the tolerance of the assertion (dashed); the largest difference is 0.65 percent.
Discrimination guards: Cooling sign at every node; the largest |dS/dt| lies between 1e-12 and 1e-4 J/kg/K/s, so a per-year value fails (a nondimensional value, about 3e-5 here, passes this bound; the finite-difference comparison catches it). The sibling test in the same file checks the zero radiogenic and tidal source arrays and the near-uniform decline in the upper molten layer.
rhs.c assembles the entropy tendency from the flux divergence and sources; it is validated as the actual derivative of the trajectory the timestepper follows, by comparing the reported tendency against the slope between closely spaced outputs.